
Figures & data
Table 1. Baseline characteristics of the patients.
Figure 1. Kaplan–Meier survival curves for 90-day mortality from ICU admission stratified by AKI stage on ICU admission. No data were censored before Day 90.
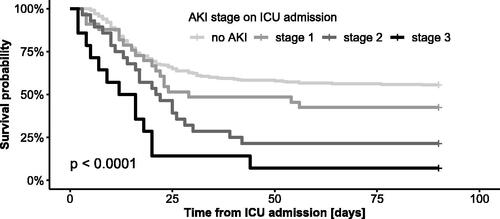
Figure 2. Cox regression analysis of the impact of AKI stage on ICU admission on ICU mortality and 90-day mortality adjusted for age, BMI, sex and comorbidities. HR, hazard ratio; aHR, adjusted hazard ratio; CCI, Charlson comorbidity index.
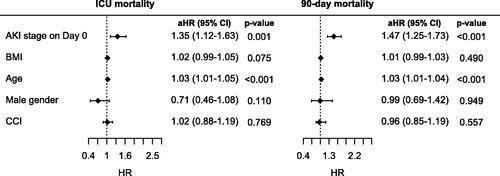
Table 2. Mortality and the need for RRT depending on AKI stage on ICU admission.
Table 3. Development of AKI stage from Day 0 to Day 2. The values indicate numbers of patients with corresponding AKI stage on Day 0 (in rows) and on Day 2 (in columns).
Table 4. Association of mortality and the need for RRT with the change in AKI stage from Day 0 to Day 2.
Figure 3. Kaplan–Meier survival curves for 90-day mortality from ICU admission stratified by change in creatinine within 48 h of ICU admission by more than 20%. No data were censored before Day 90.
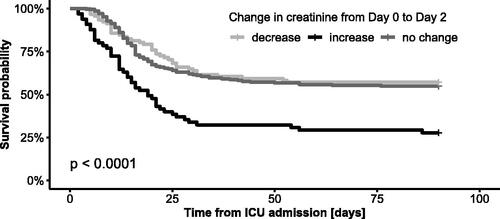
Figure 4. Cox regression analysis of the impact of change in creatinine within 48 h of ICU admission on ICU and 90-day mortality after being adjusted for age, BMI, gender and comorbidities. Stationary creatinine was used as a reference. The decrease and increase in creatinine were defined by a change in creatinine of more than 20%. HR: hazard ratio; aHR: adjusted hazard ratio; CCI: Charlson comorbidity index.

Table 5. Association of mortality and the need for RRT with a change in creatinine within 48 h of ICU admission by more than 20%.
Table 6. Association of mortality with the need for RRT and ECMO.
Figure 5. Number of COVID-19 ICU admissions per month.
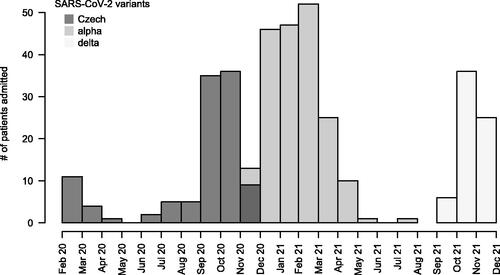
Table 7. Development of need for RRT and mortality over three waves of COVID-19 in all patients and in patients requiring RRT.
Data availability statement
Analyses of all data performed during this study are included in this manuscript. The datasets used and analyzed during the study are available from the corresponding author on reasonable request.