
Figures & data
Table 1. Baseline characteristics for all patients with IMN and MCD.
Figure 1. Diversity of gut microbiota for IMN and MCD participants. (A) Ace, (B) Chao, (C) Shannon, and (D) Simpson showed alpha diversity of gut microbiota in two groups. There was no significant difference between the IMN and MCD groups. (E) PCoA plot based on Bray–Curtis dissimilarities did not show obvious cluster of gut microbial information between the IMN and MCD groups. (F) Venn diagram illustrating the overlap of OTUs between the IMN and MCD groups with 644 OTUs shared in both groups, and 78 OTUs unique to the IMN group. IMN: idiopathic membranous nephropathy; MCD: minimal change disease; PCoA: principal coordinates analysis.
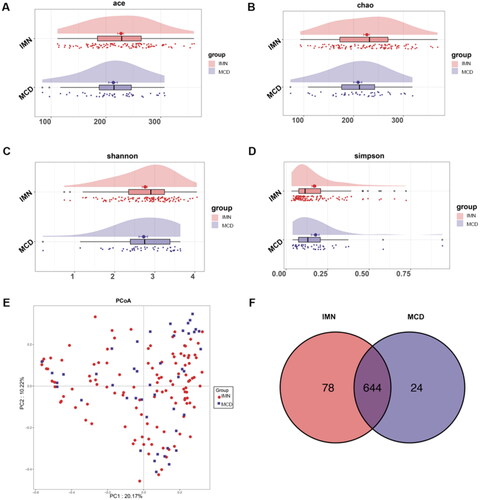
Figure 2. Composition of gut microbes for IMN and MCD participants. (A–C) Differential bacterial display of IMN and MCD at the phylum, order, and genus levels. (D) LEfSe analysis of microbial profiles. IMN: idiopathic membranous nephropathy; MCD: minimal change disease; LDA score: linear discriminant analysis score.
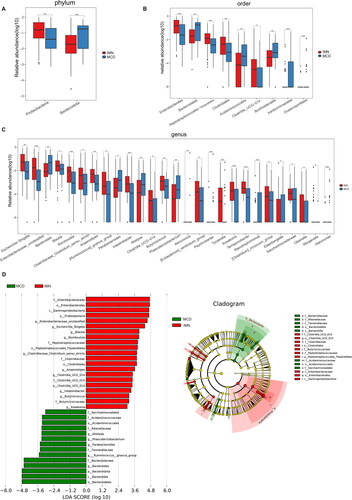
Figure 3. LEfSe analysis of metabolic pathways. Comparison (A) and distribution (B) of KEGG metabolic pathways between IMN and MCD were shown at the taxonomic level by LEfSe analysis. IMN: idiopathic membranous nephropathy; MCD: minimal change disease; LEfSe: linear discriminant analysis effect size; KEGG: Kyoto Encyclopedia of Genes and Genomes.
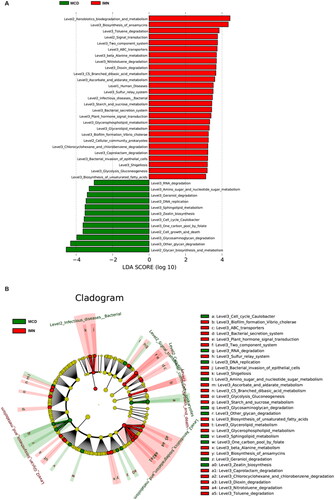
Figure 4. ROCs for IMN participants in the training group. (A) The discriminative power of each classifier for identifying IMN and MCD in training group. Model 1: clinical index, Model 2: gut microbiota, Model 3: the model combining with clinical index and gut microbiota. (B) The importance of each indicator in the model. ROC: receiver operating characteristic curve; IMN: idiopathic membranous nephropathy; TCHO: total cholesterol; LDL: low density lipoprotein; Hb: hemoglobin; TG: triglycerides.
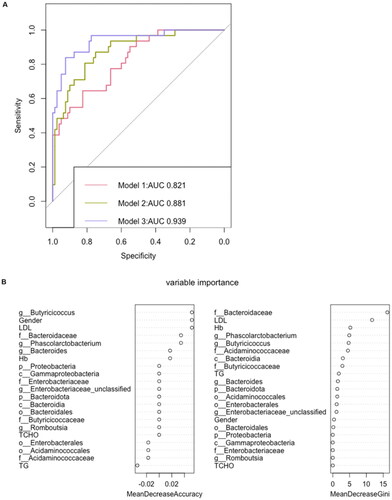
Table 2. Identification of potential risk factors in IMN and MCD by univariate and multivariate regression analyses.
Table 3. The AUC and sensitivity and specificity at Youden’s cutoff to identify IMN participants.
Figure 5. Performance evaluation of different classifiers to discriminate IMN from MCD. A total of 16 bacteria and 5 clinical data at baseline were included in the construction of the classifier. The confusion matrix of the classifier constructed by support vector machine shows that its accuracy is 92.9% in the training group and 75% in the test group. The confusion matrix of the classifier constructed by random forest shows that its accuracy is 83% in the training group and 83.3% in the test group. IMN: idiopathic membranous nephropathy, MCD: minimal change disease.
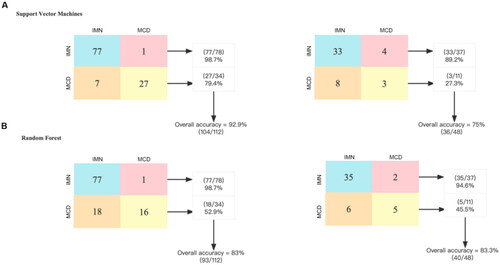
Figure 6. Validation of model discriminative efficacy in IMN (PLA2R-positive and PLA2R-negative, respectively) and MCD. (A) Verification of the effectiveness of the gut microbiota and clinical data (Model 3) in discriminating between PLA2R-positive IMN and MCD showed an AUC of 0.932. (B) Verification of the effectiveness of the gut microbiota and clinical data (Model 3) in discriminating between PLA2R-negative IMN and MCD showed an AUC of 0.932. IMN: idiopathic membranous nephropathy; MCD: minimal change disease.
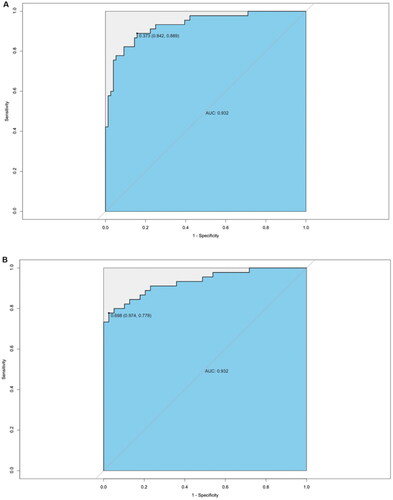
Figure 7. Distinctive gut microbiota in healthy controls, IMN, and MCD patients. (A) Differential bacteria at phylum level in HC, IMN, and MCD. (B) Differential bacteria at class level in HC, IMN, and MCD. (C) Differential bacteria at genus level in HC, IMN, and MCD. HC: healthy control; IMN: idiopathic membranous nephropathy; MCD: minimal change disease.
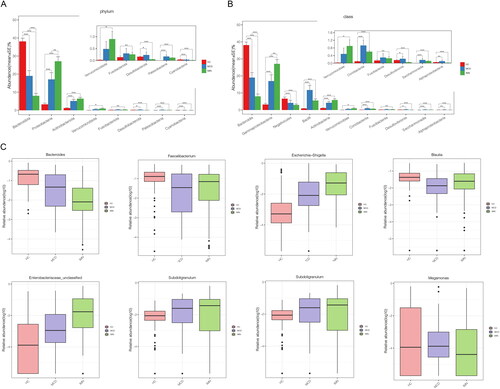
Figure 8. Validation of the gut microbiota discrimination models using external samples. The effectiveness of the identification model was verified using the gut microbiota of 10 IMNs and 10 MCDs from another center (Jinan, Shandong, China), achieving an AUC of 0.881.
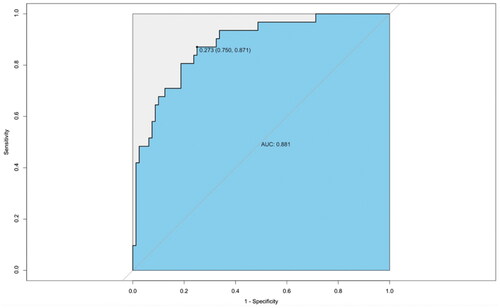
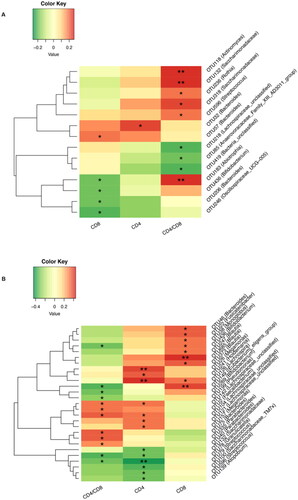
Figure 9. Correlation between gut microbiota and T-cell count. (A) Correlation analysis was performed to investigate the relationship between gut microbiota and CD4 and CD8 T-cell counts in patients with IMN. (B) Correlation analysis was performed to investigate the relationship between gut microbiota and CD4 and CD8 T-cell counts in patients with MCD. *p < .05, **p <.01.
Supplemental Material
Download PDF (183.9 KB)Data availability statement
The datasets presented in this study can be found in online repositories. The names of the repositories and accession numbers are as follows: https://www.ncbi.nlm.nih.gov/, PRJNA752445 and PRJNA832071.