
Figures & data
Figure 1. Patient inclusion flow chart.
mTPE: membrane therapeutic plasma exchange. HA: heparin anticoagulation. RCA: regional citrate anticoagulation.
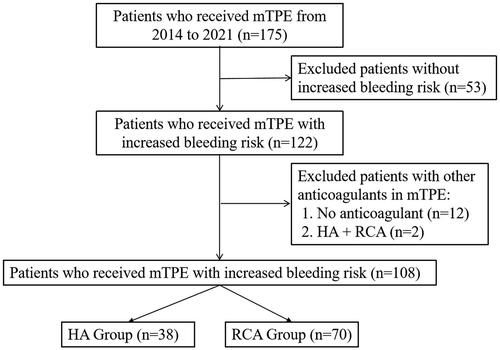
Table 1. Patients baseline characteristics.
Table 2. Distribution of etiologies.
Table 3. Comparison of the treatment-related complications with different methods of anticoagulation.
Table 4. Comparison of laboratory index, SOFA scores, and vital signs before and after HA or RCA-mTPE treatment.
Table 5. Comparison of the incidence of electrolyte and acid-base disturbances before and after HA or RCA-mTPE treatment.
Table 6. Comparison of changes in acid-base and electrolyte before and after HA or RCA-mTPE treatment.
Table 7. Predictors of bleeding episodes in patients with increased bleeding risk underwent mTPE treatment.
Data availability statement
The datasets used and/or analyzed during the current study are available from the corresponding author on reasonable request.