
Figures & data
Figure 1. Flowchart of study patients.
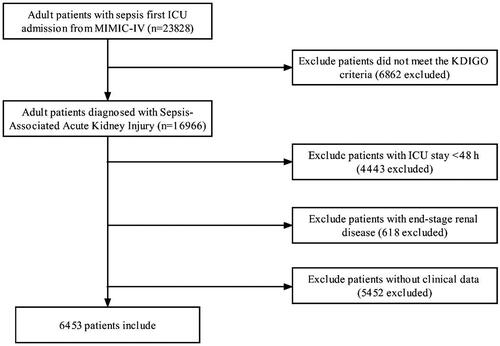
Table 1. Baseline characteristics of participants and outcome parameters.
Table 2. Hazard ratio (HR) [95% confidence intervals (CIs)] for mortality across groups divided according to the ratio of lactate dehydrogenase to albumin (LAR) level.
Figure 2. (A): Kaplan–Meier curve of 28-day mortality for patients with SA-AKI. (B) Kaplan–Meier curve of 90-day mortality for patients with SA-AKI.
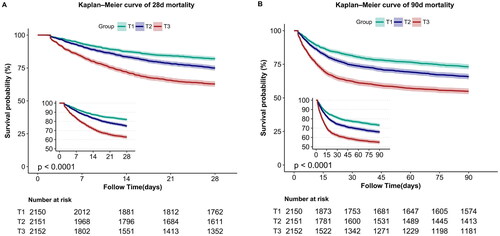
Table 3. Subgroup analysis of the association between 28-day mortality and LAR.
Figure 3. Curve fitting of the LAR (log2) and 28-day mortality in patients with SA-AKI.
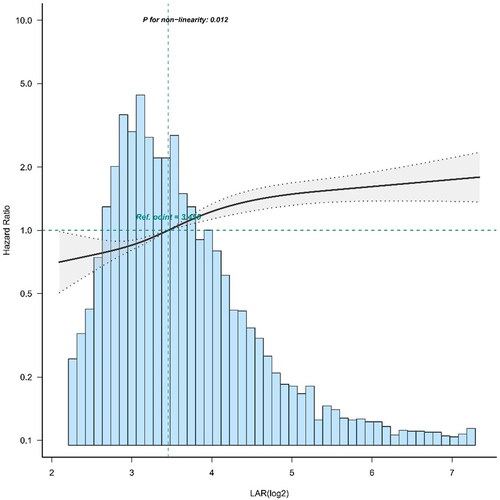
Table 4. Threshold effect analysis of the relationship between the LAR (log2) and 28-day mortality in patients with SA-AKI.
Supplemental Material
Download PDF (85.6 KB)Data availability statement
In this work, we investigated publicly accessible datasets. These datasets are available at https://physionet.org/content/mimiciv.