
Figures & data
Figure 1. Research design flow chart.
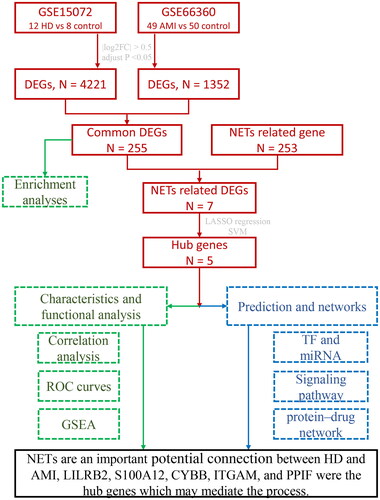
Figure 2. Differentially expressed gene identification. A, B from GSE15072, C, D from GSE66360. The volcano plots (A, C) show that 4221 and 1352 DEGs were identified from the two datasets, and the heatmaps (B, D) show the top 20 up and downregulated genes, respectively. Upregulated genes are in light red; downregulated genes are in light blue.
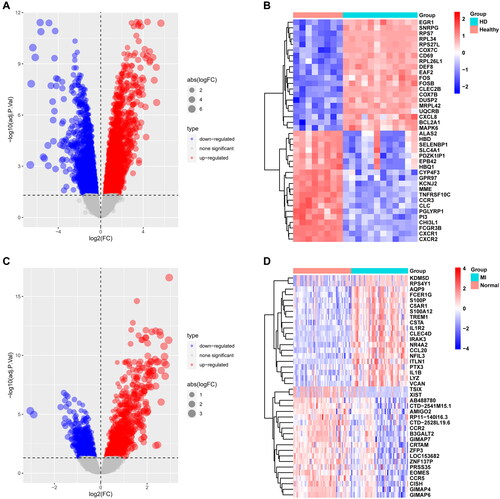
Figure 3. Identification of DEGs and enrichment analyses with common DEGs. The Venn diagrams of up- and downregulated DEGs of GSE15072 and GSE66360 show an overlap of 206 and 49 genes, respectively (A, B). Results of GO and KEGG pathway enrichment analysis (C, D). An adjusted p value < 0.05 was considered significant.
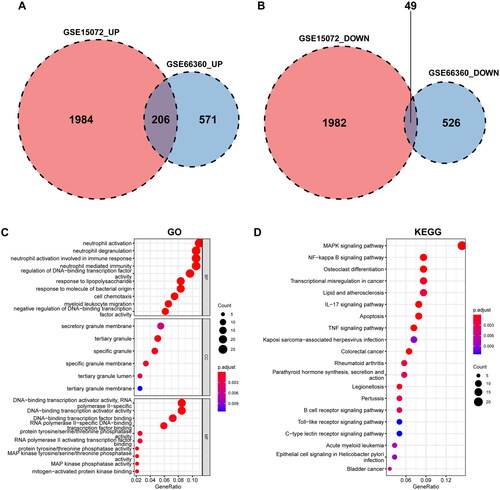
Figure 4. Identification and enrichment analyses of NET-related DEGs. The Venn diagrams show an overlap of 7 genes (A). Results of GO and KEGG pathway enrichment analysis (B, C). An adjusted p value < 0.05 was considered significant. Top 5 pathways of KEGG and the genes they contained (D).
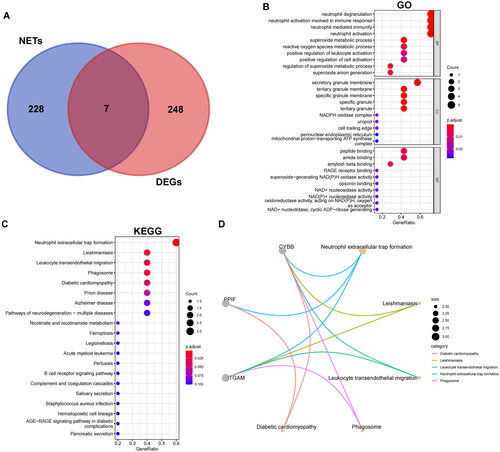
Figure 5. Selection of hub genes. LASSO regression (A, C) and SVM (B, D) of GSE15072 and GSE66360. In the Venn diagrams, five genes appear at least three times in the four gene sets (E), which are all upregulated in the two datasets. LogFC of hub genes between groups are displayed (F). The importance of seven NET-related DEGs (G, H). SVM: support vector machine.
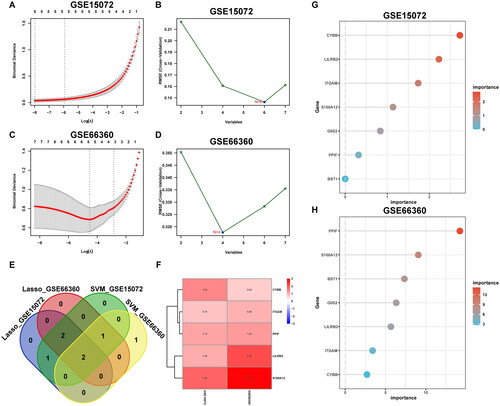
Figure 6. Correlation analysis between hub genes and ROC curves of hub genes. Correlation analysis between hub genes (A, B); red symbolizes positive and green symbolizes negative correlation, and darker color means stronger correlation. ROC curve and AUC of each hub gene (C, D).
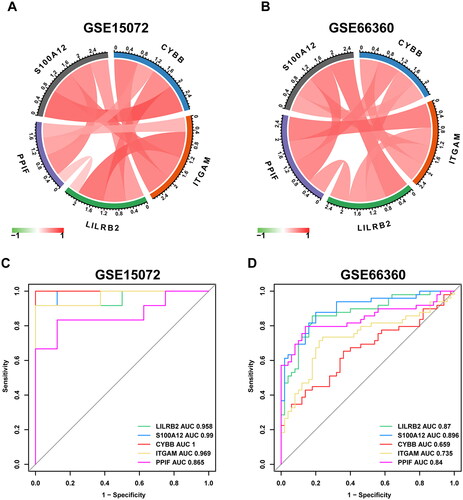
Figure 7. Network between transcription factors, miRNAs, and hub genes. Red indicates hub genes, and blue indicates transcription factors and miRNAs.
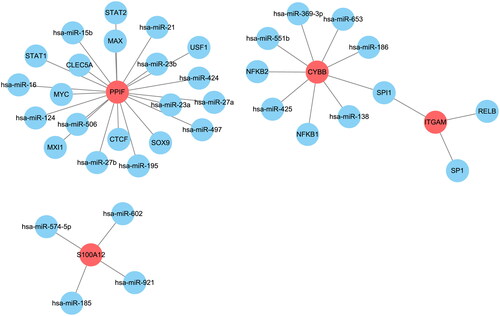
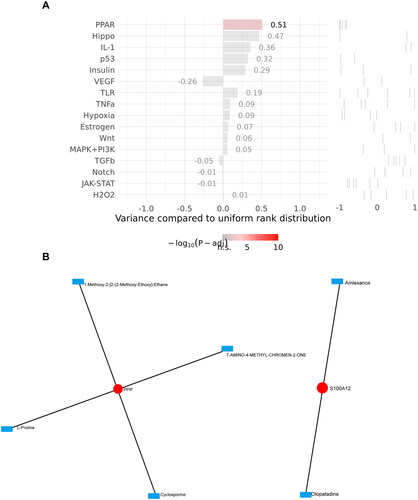
Figure 8. Prediction of signaling pathways and protein-drug network. Enrichment analysis of upstream signal pathway, shown in order of significance (A). The protein–drug network (B).
Supplemental Material
Download PDF (25.7 KB)Supplemental Material
Download PDF (1.1 MB)Data availability statement
The data that support the findings of this study are openly available in Gene Expression Omnibus at https://www.ncbi.nlm.nih.gov/geo/, reference number: GSE15072, GSE66360, and GSE48060.