
Figures & data
Table 1. General information and laboratory tests for the three groups of subjects.
Table 2. Multiple comparison results of post-hoc tests of three groups of clinical variables.
Figure 1. Clusters with significantly altered mALFF values among groups. The blue-yellow areas denote lower mALFF values in the MHD-CI group than in the (A) MHD-NCI group or (B) HC group. mALFF: mean low-frequency amplitude; MHD-CI: maintenance hemodialysis patients with cognitive impairment; MHD-NCI: maintenance hemodialysis patients without cognitive impairment; HC: healthy controls.
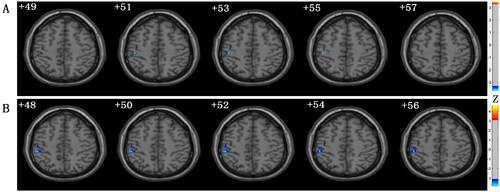
Figure 2. Clusters with significantly altered mALFF values among groups. The red-yellow areas denote higher mALFF values in the MHD-CI group than in the (A) MHD-NCI group or (B) HC group; (C) MHD-NCI group compared to the HC group. mALFF: mean low-frequency amplitude; MHD-CI: maintenance hemodialysis patients with cognitive impairment; MHD-NCI: maintenance hemodialysis patients without cognitive impairment; HC: healthy controls.
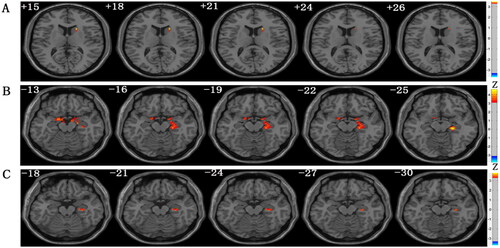
Table 3. Significant differences in mALFF values among groups.
Figure 3. Clusters with significantly altered mfALFF values among groups. The blue-yellow areas denote lower mfALFF values in the MHD-CI group than in the (A) MHD-NCI group or (B) HC group; (C) MHD-NCI group compared to the HC group. mfALFF: mean ratio low-frequency amplitude; MHD-CI: maintenance hemodialysis patients with cognitive impairment; MHD-NCI: maintenance hemodialysis patients without cognitive impairment; HC: healthy controls.
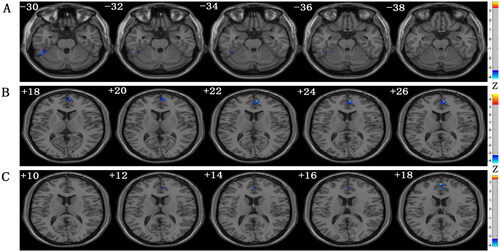
Table 4. Significant differences in mfALFF values among groups.
Figure 4. Clusters with significantly altered mReHo values among groups. (A) The blue-yellow areas denote lower mReHo values in the MHD-CI group than in the HC group. (B) The red-yellow areas denote higher mfALFF values in the MHD-CI group than in the HC group. mReHo: mean regional concordance; MHD-CI: maintenance hemodialysis patients with cognitive impairment; MHD-NCI: maintenance hemodialysis patients without cognitive impairment; HC: healthy controls.
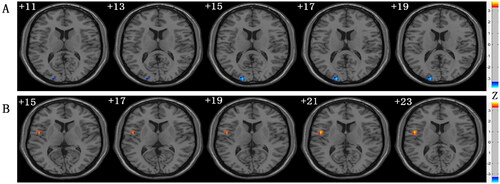
Table 5. Significant differences in mReHo values among groups.
Figure 5. (A) Correlation analysis of the mALFF values in left postcentral gyrus and MOCA score; (B) Correlation analysis of the mfALFF values in left inferior temporal gyrus and MOCA score; (C) Correlation analysis of hemoglobin level and MOCA scores; (D) Correlation analysis of urea nitrogen level and MOCA scores; (E) Correlation analysis of the mALFF values in right caudate and MOCA score.
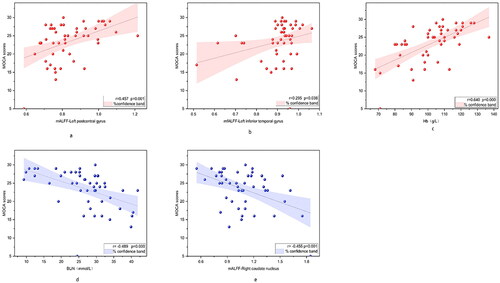
Figure 6. Back propagation neural network model. (A) Actual scores and predicted scores of BPNN based on Hb and BUN values. (B) actual scores and predicted scores of BPNN based on Hb, BUN, and mALFF values in the right caudate nucleus. (C) actual scores and predicted scores of BPNN based on Hb, BUN, and mALFF values in the left postcentral gyrus. (D) actual scores and predicted scores of BPNN based on Hb, BUN, and mALFF values in the left postcentral gyrus and right caudate nucleus. The dots in the figures indicate the subjects included in the test set of prediction models.
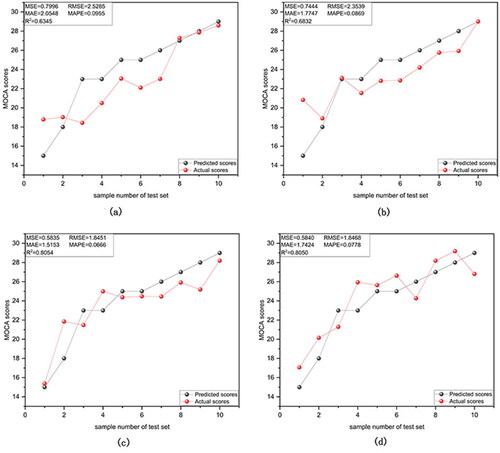
Figure 7. Validation cohort of BPNN model.
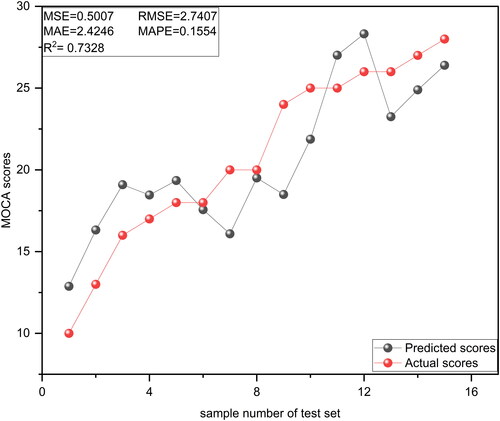
Table 6. The input layer data for the validation cohort.
Data availability statement
The datasets generated and analyzed during the current study are not publicly available because they constitute an excerpt of research in progress but are available from the corresponding author on reasonable request.