
Figures & data
Figure 1. shows the flow chart of the study population recruitment. Of 466 eligible participants, 18 cases and 30 controls were enrolled for the study.
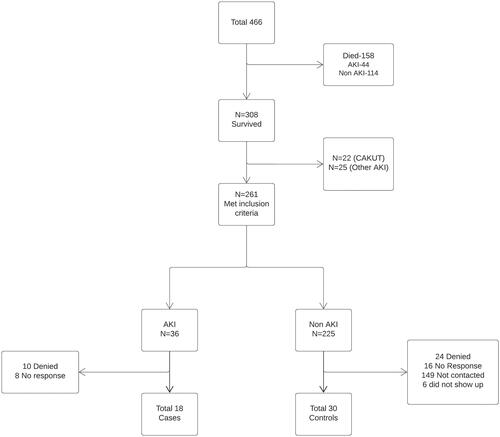
Table 1. Demographic characteristics by AKI status.
Table 2. Clinical outcome by AKI status.
Table 3. Baseline characteristics by composite primary outcome (CKD).
Table 4. Comparison of studies looking at CKD risk in children with a history of AKI during infancy.
Supplemental material