
Figures & data
Figure 1. Characterization of hucMSC-Ex. (A) Morphology of hucMSC-Ex under TEM. Scale bar, 200 nm. (B) The mean diameter of hucMSC-Ex was analyzed by NTA. (C) The exosome protein markers Alix, CD63, and TSG101 were detected by Western blot (n = 3).
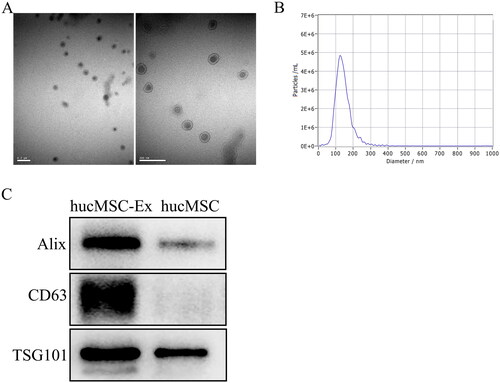
Figure 2. Effects of hucMSC-Ex on kidney histopathology and function in rats with IRI (n = 3). (A, B) Scr and BUN values in each group at 24 h. The values are presented as the mean ± SD. ***p < 0.01 vs. sham group; ##p < 0.1 vs. IRI group; ****p < 0.001 vs. sham group; ###p < 0.01 vs. IRI group. (C) Histopathological analysis of each group’s kidney. (a–d) Hematoxylin–eosin (HE) staining; (e–h) periodic acid Schiff (PAS) staining; (i–l) Masson’s staining. (D) A tubular damage score was calculated based on the percentage of tubules that displayed cell necrosis, brush loss, cast formation, and tubular dilatation: 0, no damage; 1, <25%; 2, 25–50%; 3, 50–75%; 4, >75%). Magnification: ×400. Quantification of interstitial fibrosis area as percentages of the total area. The values are presented as the mean ± SD. ***p < 0.01 vs. sham group; ##p < 0.1 vs. IRI group; **p < 0.1 vs. sham group; #p < 0.5 vs. IRI group. Sham + Ex: sham + hucMSC-Ex; IRI + Ex: IRI + hucMSC-Ex.
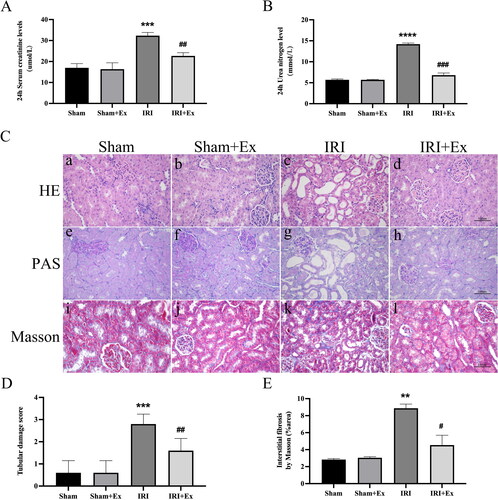
Figure 3. HucMSC-Ex inhibited AKI. (A) Immunohistochemical analysis of each group’s kidney. (a–d) Representative immunohistochemical images of vimentin. (e–h) Representative immunohistochemical images of α-SMA. (B) Examination of fibronectin, vimentin, and α-SMA protein expression. (C–E) An analysis of the relative levels of protein expression in each group (n = 3). The values are presented as the mean ± SD. *p < 0.5 vs. sham group; #p < 0.5, ##p < 0.1 vs. IRI group. Sham + Ex: sham + hucMSC-Ex; IRI + Ex: IRI + hucMSC-Ex.
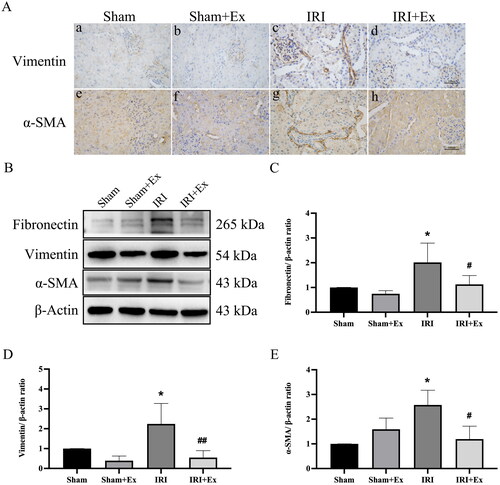
Figure 4. HucMSC-Ex inhibits renal pyroptosis in vivo. (A) Representative scanning electron micrographs of pyroptosis in kidney. (B) Representative transmission electron microscopes of pyroptosis in kidney. (C) Immunohistochemical analysis of each group’s kidney. (a–d) Immunohistochemical analysis of NLRP3. (e–h) Immunohistochemical analysis of caspase-1. (i–l) Immunohistochemical analysis of IL-1β. (D–H) Western blot analysis of NLRP3, GSDMD, caspase-1 p20, and IL-1β expression in each group (n = 3). The values are presented as the mean ± SD. *p < 0.5, ****p < 0.001 vs. sham group; #p < 0.5 vs. IRI group. Sham + Ex: sham + hucMSC-Ex; IRI + Ex: IRI + hucMSC-Ex.
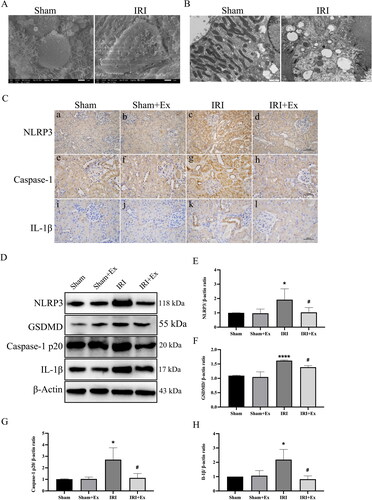
Figure 5. Cellular uptake of hucMSC-Ex (n = 3). Representative confocal images of the cellular uptake of pkh26-labeled hucMSC-Ex and fluorescence intensity analysis (n = 3). The values are presented as the mean ± SD. Compared with the previous time point, *p < 0.5, ***p < 0.01 PKH26-labeled hucMSC-Ex: red; DAPI-labeled nucleus: blue.
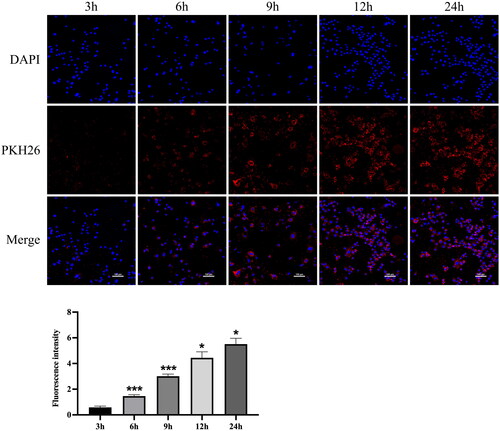
Figure 6. HucMSC-Ex inhibit renal fibrosis in vitro. (A) Eight different concentrations of cisplatin were used to treat NRK-52E cells for 24 h, and CCK-8 was used to assess cell viability. (B–E) Western blot analysis of fibronectin, vimentin, and α-SMA expression (n = 3). The values are presented as the mean ± SD. *p < 0.5, ***p < 0.01 vs. sham group; #p < 0.5 vs. IRI group. Sham + Ex: Sham + hucMSC-Ex; IRI + Ex: IRI + hucMSC-Ex.
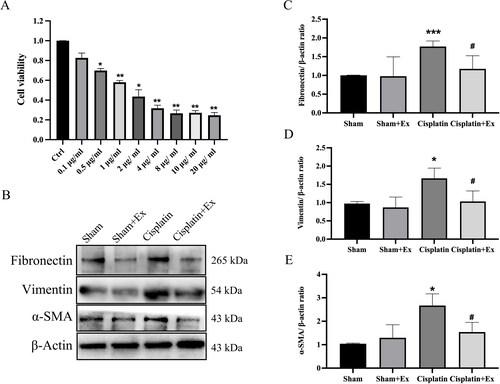
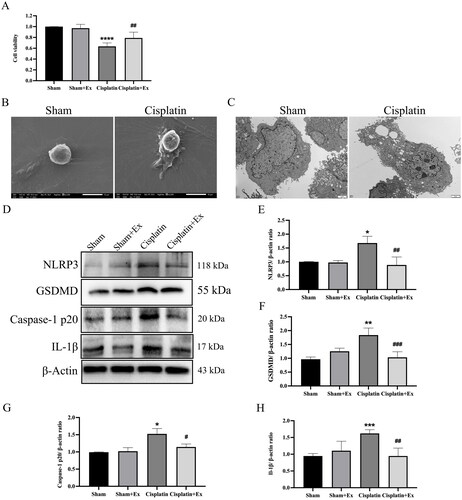
Figure 7. HucMSC-Ex inhibit renal pyroptosis in vitro. (A) NRK-52E cells were treated with 1 µg/mL cisplatin and 160 µg/mL hucMSC-Ex, and cell viability was detected by using CCK-8. (B) Representative scanning electron micrographs of pyroptosis in NRK-52E cells. (C) Representative transmission electron microscopes of pyroptosis in NRK-52E cells. (D–H) Western blot analysis of NLRP3, GSDMD, caspase-1 p20, and IL-1β expression (n = 3). The values are presented as the mean ± SD. *p < 0.5, **p < 0.1, ***p < 0.01 vs. sham group; #p < 0.5, ##p < 0.1, ###p < 0.01 vs. IRI group. Sham + Ex: Sham + hucMSC-Ex, IRI + Ex: IRI + hucMSC-Ex.
Data availability statement
The datasets used and/or analyzed during the current study are available from the corresponding author on reasonable request.