
Figures & data
Figure 1. Synthetized translation process of the questionnaire.
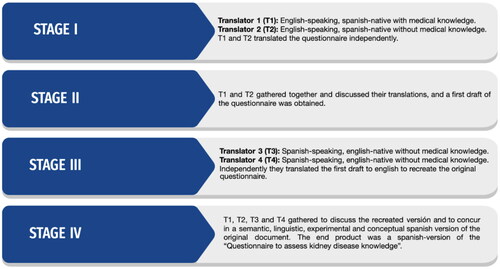
Figure 2. Answers by each group. Correct answers: 22/24 in nephrologists with a standard deviation (SD) 1.2, 18/24 in students with a SD of 2.7, 13.8/24 in normal subjects with 3.9 SD and 13.4/24 in high risk population with 4.5 of SD.
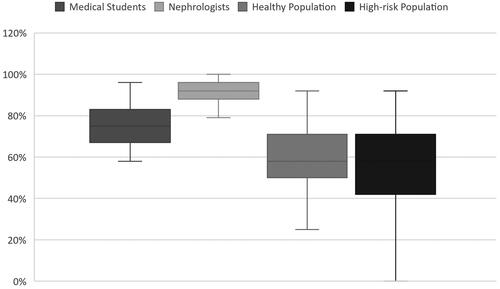
Table 1. Demographics of population at risk.
Table 2. Results of the questionnaire by group.
Table 3. Questionnaire responses divided by group.