Figures & data
Figure 1. Flow-chart of the recruitment of the patients.
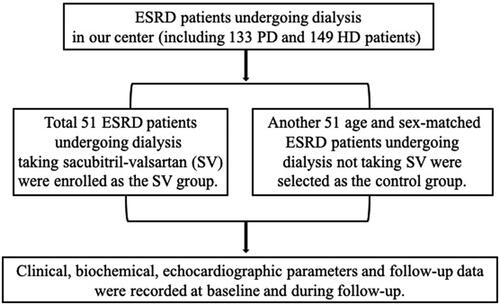
Table 1. Baseline data of the sacubitril-valsartan (SV) group and control group patients.
Figure 2. Levels of BNP or NT-proBNP before and after sacubitril-valsartan (SV) introduction in SV group. BNP, B-type natriuretic peptide; NT-proBNP, pro-B-type natriuretic peptide; PD, peritoneal dialysis; HD, hemodialysis.
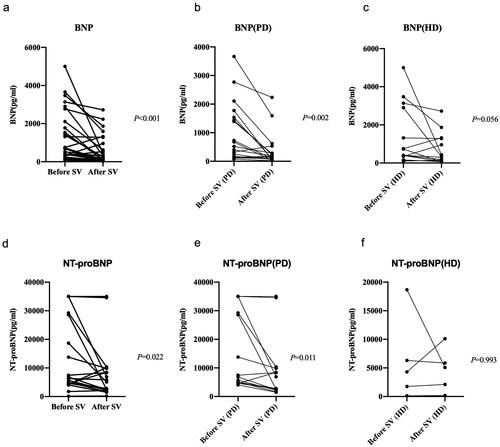
Table 2. Comparison of echocardiography parameters between SV and control group.
Table 3. Comparison of echocardiography parameters between PD patients and the control group.
Table 4. Fluid statue and urine of SV and control group.
Figure 3. Baseline and follow-up data of blood pressure and heart rate in the SV group and control group. SBP, systolic blood pressure; DBP, diastolic blood pressure; HR, heart rate.
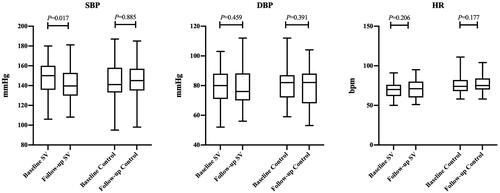
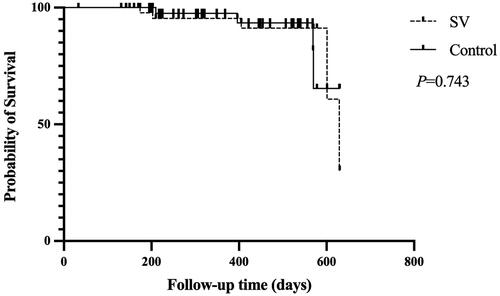
Figure 4. Kaplan-Meier curve of the composite endpoints events in the SV group and the control group.