
Figures & data
Table 1. Patients characteristics.
Figure 1. Flow chart for the surgery and type of fracture.
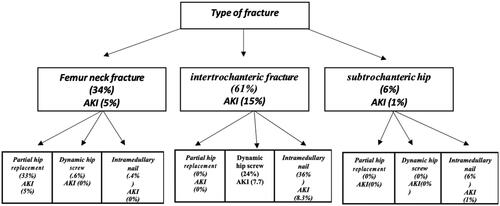
Table 2. Factors affecting the development of postoperative AKI.
Table 3. Result of development postoperative AKI.
Table 4. Factors affecting the mortality postoperatively.
Figure 2. Kaplan Meier curve; AKIPostOP: acute kidney injury postoperatively; N: no; Y: yes; the red line represent the survival of the patients who didn’t develop postoperative AKI; the blue one represent the survival of the patients who developed postoperative AKI.
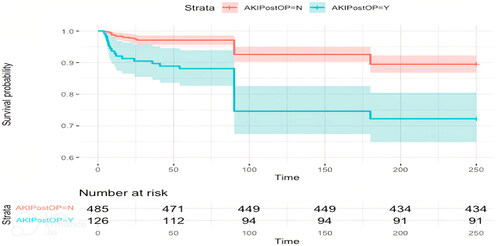
Table 5. Survival table.
Supplemental material