
Figures & data
Figure 1. Flowchart of the patients included in this study.
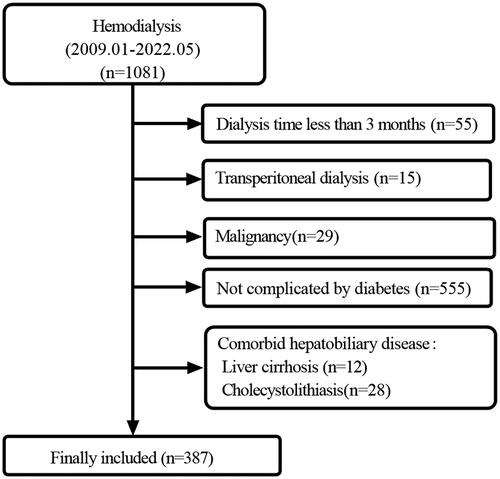
Figure 2. The optimal cut-point value of bile acids.
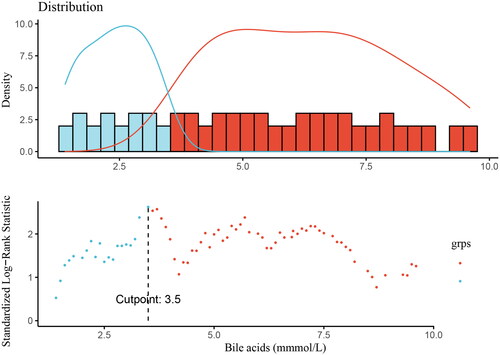
Figure 3. Dynamic HR changes with bile acids levels. HR, dynamic risk ratio.
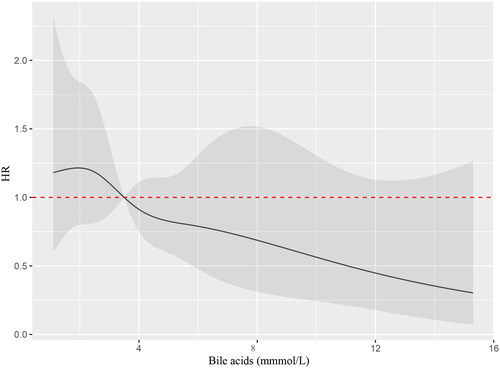
Table 1. Baseline clinical features of enrolled 387 patients on MHD with DM.
Table 2. Correlations of BAs levels with different clinicopathological data.
Figure 4. The relationship between varying levels of BAs and all-cause death in MHD with DM patients.
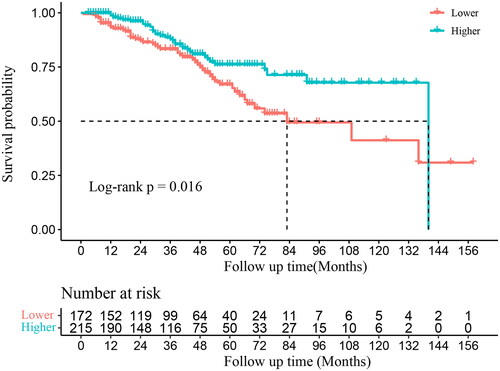
Figure 5. The relationship between varying levels of BAs and cardiovascular death in MHD with DM patients.
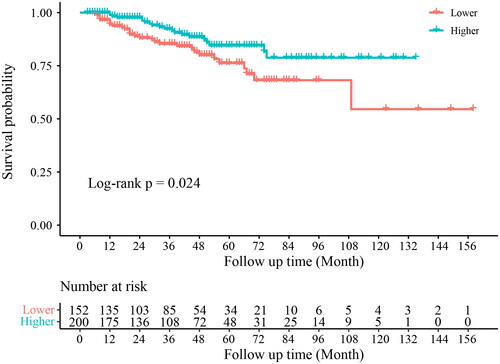
Table 3. Associations between BAs level and all-cause death in MDH with DM.
Supplemental Material
Download Zip (1.4 MB)Data availability
All datasets generated during and/or analyzed during the current study are available from the corresponding author upon reasonable request.