Figures & data
Figure 1. Comparison between basic and modified adenine diets and compositions of the optimized diets. Changes of body weight (a), average food intake (B), and survival rates (C) in mice fed a basic and modified adenine diet. (D) Proportion of nutritional ingredients in each kind of feed. (E) Total energy and proportion of energetic substance in each kind of feed. Notes: (1) Recipe and nutritional ingredient of feed were shown in the supplementary 1; (2) the total energy (kcal/Kg) = [protein (g)*4 + carbohydrate (g)*4 + fat (g)*9]*10.
![Figure 1. Comparison between basic and modified adenine diets and compositions of the optimized diets. Changes of body weight (a), average food intake (B), and survival rates (C) in mice fed a basic and modified adenine diet. (D) Proportion of nutritional ingredients in each kind of feed. (E) Total energy and proportion of energetic substance in each kind of feed. Notes: (1) Recipe and nutritional ingredient of feed were shown in the supplementary 1; (2) the total energy (kcal/Kg) = [protein (g)*4 + carbohydrate (g)*4 + fat (g)*9]*10.](/cms/asset/c6725eea-0d74-4d27-a7b8-9cce7bf62f56/irnf_a_2228920_f0001_c.jpg)
Figure 2. Protocols for the study design and comparison of different diet modes in survival rate and body weight. (A) Probability of survival in different diet groups throughout the study duration. (B) Schematic overview of the study design for different models. (C) Body weight in different models throughout the study duration.
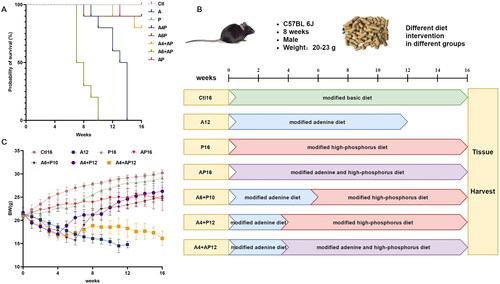
Figure 3. Comparison of different diet modes in kidney impairment and mineral homeostasis disorder. Bilateral renal weight were shown in (a). serum levels of (B) creatinine (Cr), (C) blood urea nitrogen (BUN), (D) calcium (Ca), (E) phosphorus (P), (F) parathyroid hormone (PTH) and (G) fibroblast growth factor 23 (FGF23) were measured at the end of the experimental period. Data are the mean ± SEM. ****p<0.0001, ***p<0.001, **p<0.01, *p<0.05 vs Ctl16, determined by ANOVA with Bonferroni multiple comparison test. Samples in each group: Ctl16 (n = 10), A12 (n = 6), P16 (n = 10), AP16 (n = 9), A6 + P10 (n = 9), A4 + P12 (n = 10), and A4 + AP12 (n = 9).
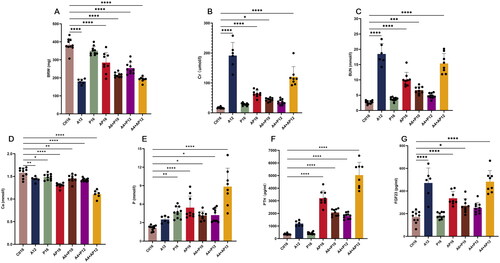
Figure 4. Representative histopathological images in renal tissues from different groups and semiquantitative analyses of glomerulus sclerosis and interstitial fibrosis. Renal tissues were evaluated in each group using hematoxylin and eosin (H&E) (A1–7, B1–7), von Kossa (C1–7, D1–7), and Masson staining (E1–7, F1–7). Invasion of inflammatory cells (green triangle), tubular luminal expansion (yellow triangle), protein casts (blue triangle and yellow square), contracted glomerular capillary tuft (black triangle), calcified deposits in the tubulointerstitial compartment including tubular lumen (green arrowhead) and interstitial (violet arrowhead), calcification in tubular basement membrane (yellow arrowhead), parietal layer of renal capsule (blue arrowhead), and renal small arteries (black arrowhead), interstitial fibrosis (black square), matrix deposition in glomerular capillary tuft (green square). Semiquantitative analyses of kidney injury were performed according to the proportion of sclerotic glomeruli based on H&E staining (G) and the percentage of fibrotic area based on Masson staining (H). the proportion of sclerotic glomeruli were calculated as the number of sclerotic glomeruli divided by the total number of glomeruli in the same 200× field view. Fibrotic area and the total renal tissue area were measured using Image-Pro plus (version 6.0). Data are the mean ± SEM. ****p<0.0001, ***p< 0.001, **p<0.01, *p<0.05 vs Ctl16, determined by ANOVA with Bonferroni multiple comparison test. N = 5/each group.
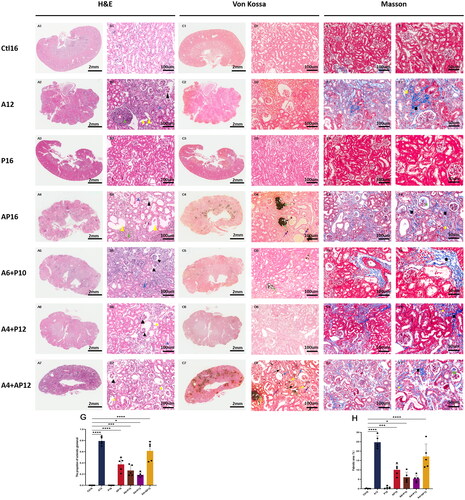
Figure 5. Representative histopathological images in aorta valvular tissues from different groups. Aorta valvular tissues were evaluated in each group using hematoxylin and eosin (H&E) (A1–7), and von Kossa (B1–7, C1–7).
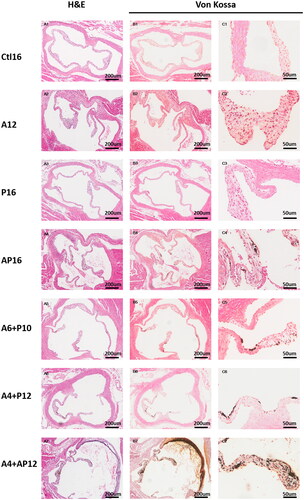
Figure 6. Representative histopathological images in thoracic aorta tissues from different groups. Thoracic aorta tissues were evaluated in each group using hematoxylin and eosin (H&E) (A1–7, B1–7), and von Kossa (C1–7, D1–7).
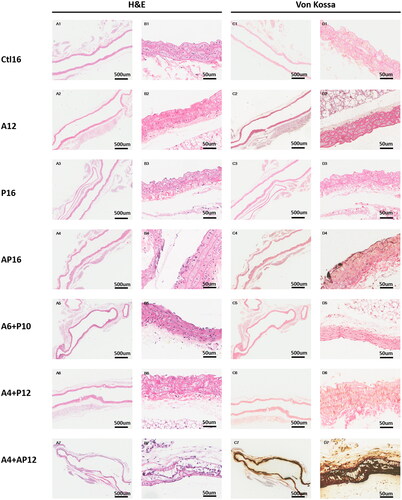
Figure 7. Representative histopathological images in thoracic aorta and renal tissues from the A4 + AP12 group. The continuous renal tissue slices were stained with H&E (A, B) and von Kossa (C, D). calcified depositions were observed in the glomerular basement membrane (grey arrowhead) and tubular basement membrane (yellow arrowhead). Representative images of moderate aorta calcification were stained with H&E (E, F) and von Kossa (G, H).
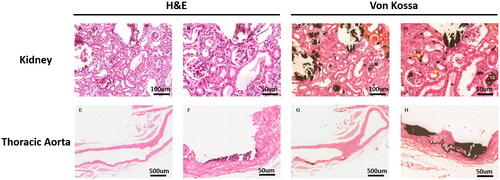
Figure 8. Quantitative comparisons of calcified deposition in the kidney, aortic valves, and thoracic aorta. The percentage of calcified area (CA) in the kidney (a), aortic valve (B) and thoracic aorta (C). CA and tissue area (TA) were measured using Image-Pro plus software (version 6.0). samples in each group: Ctl16 (n = 10), A12 (n = 6), P16 (n = 10), AP16 (n = 9), A6 + P10 (n = 9), A4 + P12 (n = 10), and A4 + AP12 (n = 9). the tissue calcium content was in the (D) kidney, (E) heart, and (F) abdominal aorta. Data are the mean ± SEM. ****p<0.0001, ***p< 0.001, **p<0.01, *p<0.05 vs Ctl16, determined by ANOVA with Bonferroni multiple comparison test. N = 5/each group.
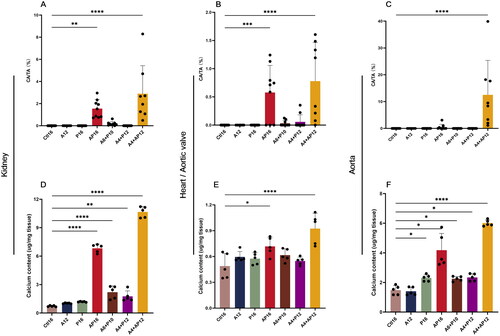
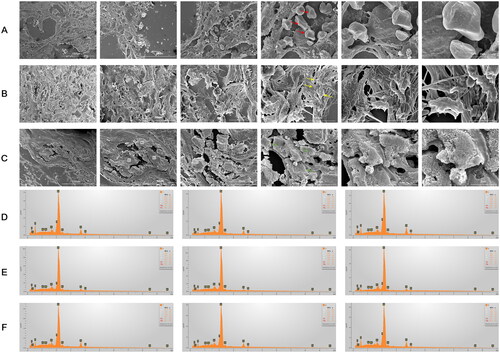
Figure 9. SEM images and EDS Mapping analyses of kidney, aortic valve and thoracic tissues. The calcified deposition was observed in the kidney (a), aortic valve (B), and thoracic tissues (C) by SEM images. The calcified deposition in three distinct forms were labeled arrowhead with spherical particles (red arrowhead), fibers (yellow arrowhead) and compact material (green arrowhead). three regions of each tissue showing dense structures in SEM images were measured by EDS (D-F). the information of EDS spectra and their elementary composition were collected on micrographs of the kidney (a), aortic valve (B), and thoracic tissues (C) at the numbered sites labeled 1-3 (D), 4-6 (E), 7-9 (F), respectively. These structures contained an abundance of oxygen, carbon, calcium and phosphorus in descending order by content, with small amounts of magnesium and sodium.