
Figures & data
Figure 1. Angiotensin II-induced podocyte detachment and impaired kidney function. (A) Representative images of HE and PAS staining in normal saline (ctrl) and Ang II-infused mice. Scale bars:20µm. (B) Representative immunofluorescent staining of synaptopodin (podocyte‐specific marker, red) and DAPI (blue) in different groups, Scale bars:20µm. (C) Quantitative determination of 24h urine Total protein (UTP) in ctrl and Ang II-infused group (n = 6), *p < 0.05. (D) Representative images of adhesion assays in ctrl and Ang II-treated podocytes in cultures. Scale bars = 250µm. (E) Quantitative determination of podocyte numbers in ctrl and Ang II-treated podocytes in cultures (n = 5), *p < 0.05.
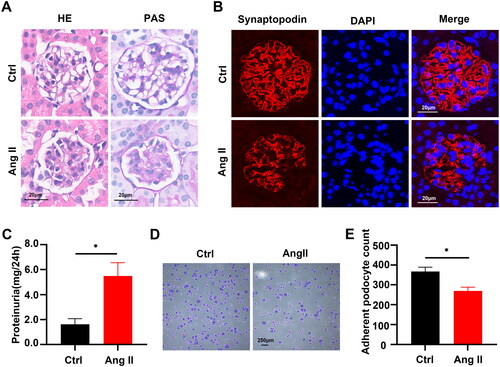
Figure 2. Angiotensin II stimulation induced decreased PFKFB3 expression in podocytes. (A) Representative Immunohistochemical staining of PFKFB3 in glomeruli from different groups. Scale bars: 20 µm. (B) Representative immunofluorescence image of PFKFB3 in ctrl and Ang II-treated podocytes in cultures obtained by confocal microscopy, Scale bars: 20 μm. (C) Representative immunofluorescent staining of PFKFB3 (green) and synaptopodin (podocyte‐specific marker, red) in ctrl and Ang II-infused mice, Scale bars: 20 µm. (D) Representative Western blots of PFKFB3 in glomeruli from ctrl and Ang II-infused mice. (E) Representative Western blots of PFKFB3 in ctrl and Ang II-treated podocytes in cultures. (F) Quantitative determination of Western blots of PFKFB3 expression in ctrl and Ang II-infused mice (n = 6), *p < 0.05. (G) Quantitative determination of Western blots of PFKFB3 expression in ctrl and Ang II- treated podocytes in cultures (n = 3), *p < 0.05.
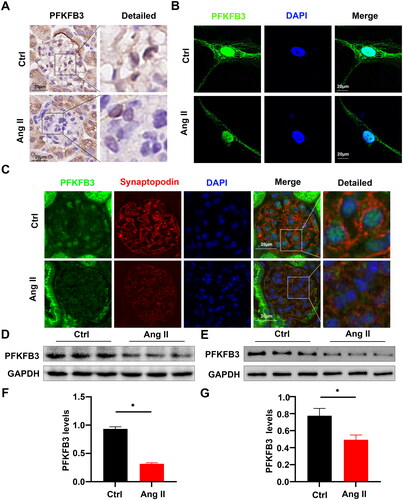
Figure 3. PFKFB3 participated in the regulation of adhesion molecule expression in vivo. Representative immunofluorescent staining of synaptopodin (podocyte‐specific marker, red) and DAPI (blue) in 3PO (A) or meclizine (B) treated groups, Scale bars:20µm. (C) Representative Western blots of phosphorylation of Talin1 and active ITGB1, and PFKFB3 in each treatment groups of mice. (D) Quantitative determination of Western blots of PFKFB3, ITGB1, p-Talin1 expression in each group (n = 6), *p < 0.05. (E) Representative Western blots of phosphorylation of Talin1 and active ITGB1, and PFKFB3 in each treatment groups of mice. (F) Quantitative determination of Western blots of PFKFB3, ITGB1, p-Talin1 expression in each group (n = 6), *p < 0.05.
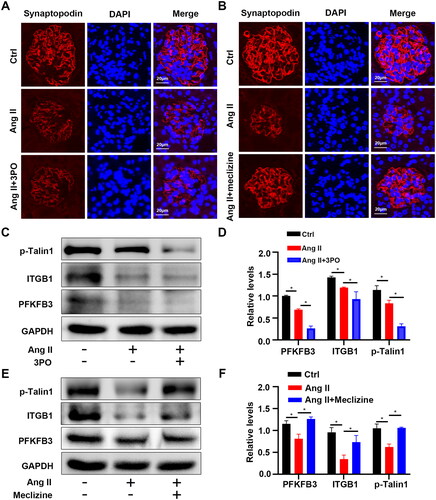
Figure 4. Regulation of podocyte adhesion was mediated by PFKFB3 in vitro. (A) Representative images of adhesion assays in different treatment groups of podocytes, Scale bars = 250 µm. (B) Quantitative determination of podocyte numbers in each group (n = 5), *p < 0.05. (C) Representative images of adhesion assays in different treatment groups of podocytes, Scale bars = 250 µm. (D) Quantitative determination of podocyte numbers in each group (n = 5), *p < 0.05. (E) Representative Western blots of phosphorylation of Talin1 and active ITGB1, and PFKFB3 in different treatment groups of podocytes. (F) Quantitative determination of Western blot of PFKFB3, ITGB1, p-Talin1 expression in each group (n = 3), *p < 0.05. (G) Representative Western blots of phosphorylation of Talin1 and active ITGB1, and PFKFB3 in different treatment groups of podocytes. (H) Quantitative determination of podocyte numbers in each group (n = 3), *p < 0.05.
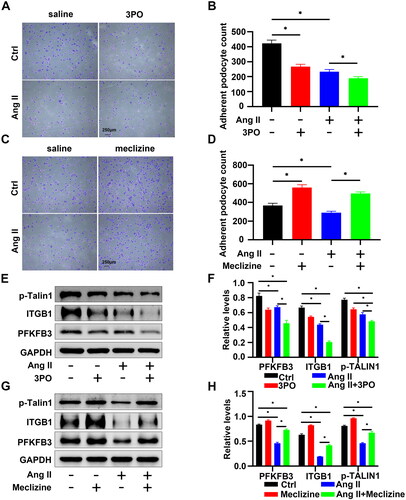
Figure 5. Angiotensin II-induced podocyte detachment in vitro is exacerbated by PFKFB3 knockdown. (A) Representative images of adhesion assays in NC-siRNA or siPFKFB3 transfected podocytes, Scale bars = 250 µm. (B) Quantitative determination of podocyte numbers in NC-siRNA or siPFKFB3 transfected podocytes (n = 3), *p < 0.05. (C) Representative Western blots of PFKFB3 in Nc-siRNA and siPFKFB3 transfected podocytes. (D) Quantitative determination of Western blot of PFKFB3 expression in podocytes transfected Nc-siRNA and siPFKFB3mice (n = 3), *p < 0.05. (E) Representative Western blots of phosphorylation of Talin1 and active ITGB1, and PFKFB3 in podocytes transfected Nc-siRNA and siPFKFB3. (F) Quantitative determination of Western blot of phosphorylation of Talin1 and active ITGB1, and PFKFB3 expression in transfected Nc-siRNA and siPFKFB3 podocytes (n = 3), *p < 0.05.
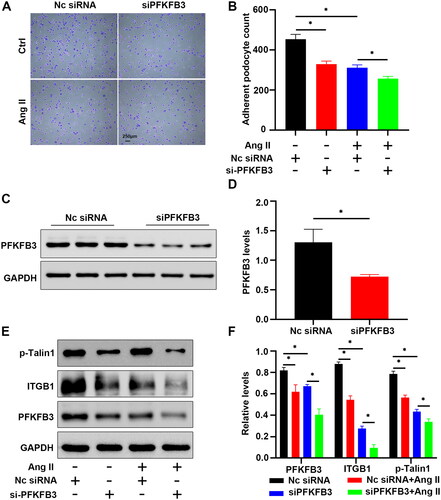
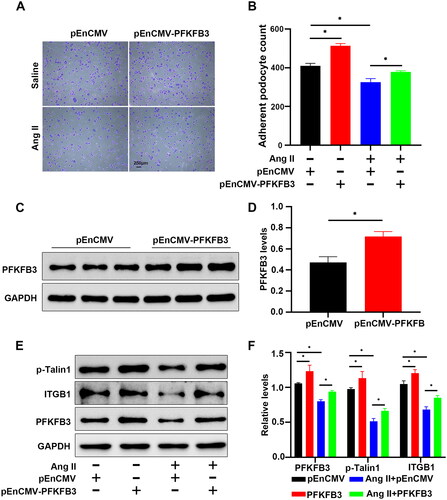
Figure 6. Overexpressed PFKFB3 ameliorated Ang II-induced podocyte detachment in vitro. (A) Representative images of adhesion assays in pEnCMV or pEnCMV-PFKFB3 transfected podocytes Scale bars = 300 µm. (B) Quantitative determination of podocyte numbers in pEnCMV or pEnCMV-PFKFB3 transfected podocytes (n = 5), *p < 0.05. (C) Representative Western blots of PFKFB3 in pEnCMV or pEnCMV-PFKFB3 transfected podocytes. (D) Quantitative determination of Western blot of PFKFB3 expression in pEnCMV or pEnCMV-PFKFB3 transfected podocytes. (n = 3), *p < 0.05. (E) Representative Western blots of phosphorylation of Talin1 and active ITGB1, and PFKFB3 in pEnCMV or pEnCMV-PFKFB3 transfected podocytes. (F) Quantitative determination of Western blots of phosphorylation of Talin1 and active ITGB1, and PFKFB3 expression in pEnCMV or pEnCMV-PFKFB3 transfected podocytes (n = 3), *p < 0.05.
Supplemental Material
Download (4.1 MB)Supplemental Material
Download PDF (532.9 KB)Data availability statement
All the data supporting this research are available from the corresponding author upon reasonable request.