Figures & data
Figure 1. Flow chart of the participants.
Note: ‘critically ill’ refers to individuals who had experienced cardiovascular events or hospitalization within the past 3 months, or who had acute infections or malignancies.
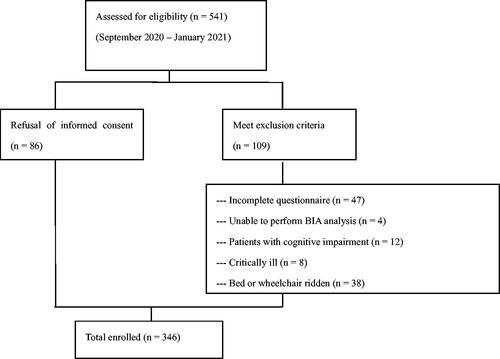
Table 1. Baseline characteristics of the training set and validation set.
Table 2. Univariate analysis for LSMI in the training set.Table Footnotea
Table 3. Multivariate logistic regression analysis for LSMI in the training set.Table Footnotea
Figure 2. The nomogram for predicting LSMI based on the training cohort (n = 244). HGS: handgrip strength; GS: gait speed; BMI: body mass index.
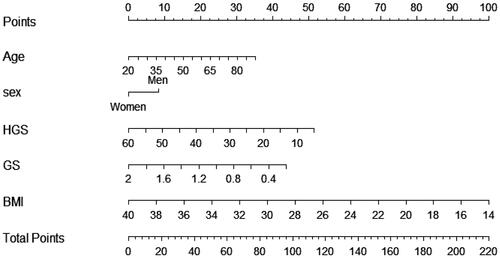
Figure 3. The ROC curves of nomogram for predicting LSMI in the training set (A, n = 244) and validation set (B, n = 102).
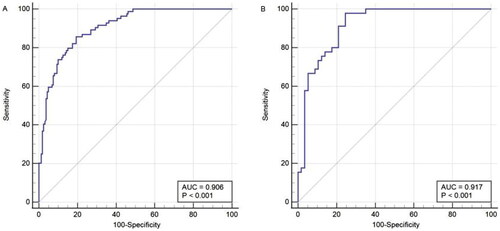
Table 4. Accuracy of the nomogram to predict low skeletal muscle mass index.
Figure 4. The calibration curves for predicting LSMI in the training (A, n = 244) and validation (B, n = 102) sets.
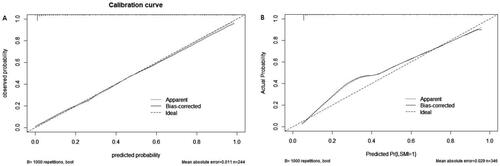
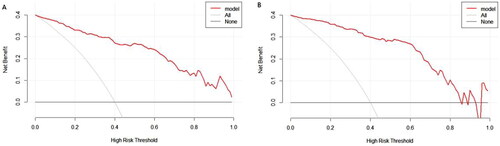
Figure 5. Decision curves for the proposed nomogram model in (A, n = 244) the training set and (B, n = 102) the validation set.