
Figures & data
Figure 1. Flowchart of study participants.
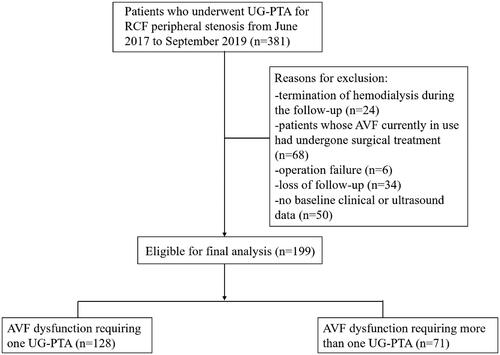
Table 1. Baseline characteristics (at first UG-PTA) by number of PTAs during follow-up.
Table 2. Ultrasonographic examinations of the 199 procedures.
Figure 2. AVF survival curves after 6-, 12-, and 24-months follow-up. (a) Primary patency. (b) Secondary patency.
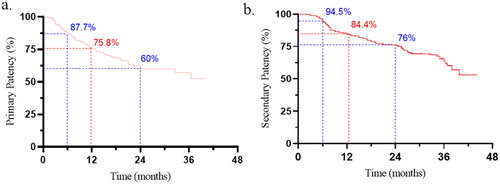
Table 3. Success and complication rates.
Figure 3. Kaplan–Meier’s cure of estimated primary patency. (a) Comparisons between PTH < 394 pg/mL and ≥394 pg/mL. (b) Comparison between non-previously failed AVF and previously failed AVF.
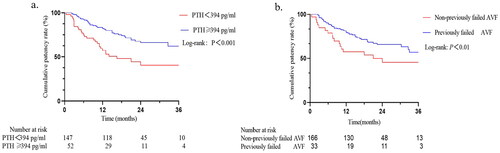
Table 4. Univariate and multivariate analyses of the effect of baseline patient characteristics on primary patency.
Data availability statement
The data underlying this article will be shared on reasonable request with the corresponding authors.