
Figures & data
Figure 1. Enrollment and exclusion of the study cohort. Among the 174 subjects underwent assessment, 163 of them received CMR examination. Two subjects were excluded because of incomplete data. 161 subjects were finally analyzed with 27 patients reached the primary outcome during the follow-up time.
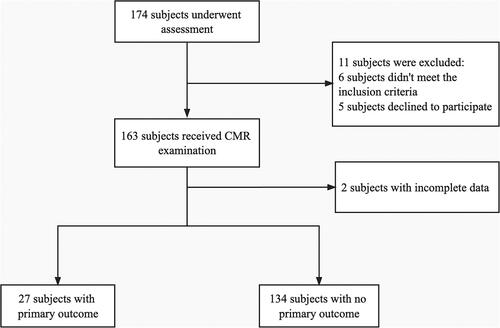
Table 1. Baseline characteristics of enrolled patients.
Figure 2. Exemplary SWE images of kidney transplantation recipients who experienced the primary outcome or not. (a) B-mode image and color-coded shear wave elastography (SWE) map in a 47-year-old female who had the kidney transplantation 3 years before the SWE examination, and did not experience the primary outcome during the follow-up time. Regions of interest (ROI) were placed in the anterior aspect of the cortex (1+) and medulla (2+) as shown with the white circle. (b) B-mode image and color-coded shear wave elastography (SWE) map in a 39-year-old male who had the kidney transplantation 2 years before the SWE examination, and experienced the primary outcome (kidney graft deterioration) during the follow-up time. Regions of interest (ROI) were placed in the anterior aspect of the cortex (1+) and medulla (2+) as shown with the white circle.
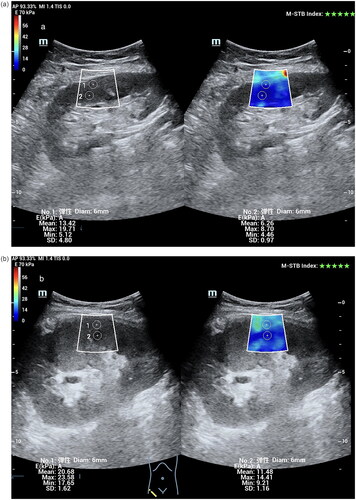
Table 2. Elastography parameters of patients who reached the Endpoint and not.
Figure 3. ROC Curves for associations between SWE and conventional ultrasound parameters and adverse outcome in kidney transplantation recipients. The mean medulla SWE cutoff was 9.63 kPa in this population (area under curve [AUC]: 0.66). the median medulla SWE cutoff was 9.68 kPa (AUC: 0.67). SWE: shear wave elastography.
![Figure 3. ROC Curves for associations between SWE and conventional ultrasound parameters and adverse outcome in kidney transplantation recipients. The mean medulla SWE cutoff was 9.63 kPa in this population (area under curve [AUC]: 0.66). the median medulla SWE cutoff was 9.68 kPa (AUC: 0.67). SWE: shear wave elastography.](/cms/asset/32d530a2-4f86-4033-84b3-7787a8ec6233/irnf_a_2235015_f0003_c.jpg)
Figure 4. Kaplan-Meier Curves for SWE medulla stiffness and adverse outcome in kidney transplantation recipients. Survival probability and the number of risk for kidney transplantation recipients with mean (a) and median (b) medullary stiffness above and below cutoff values during the follow-up time are shown in green and red, respectively. Log-rank test was performed to compare the two groups of patients (p < 0.001). SWE: shear wave elastography.
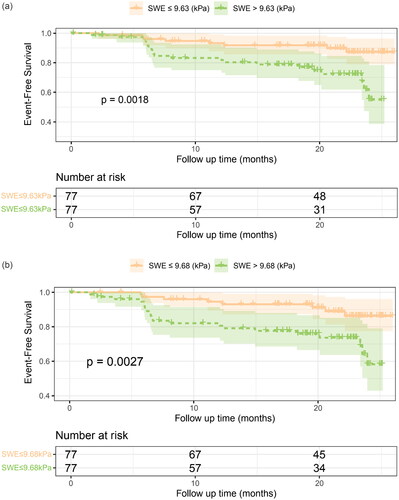
Table 3. Results of univariable Cox Analyses for the prediction of the incident of adverse events.
Figure 5. Time-dependent AUC curves demonstrating the stability of AUC values of predictive models during the follow-up time. The solid green lines show that AUC values of different predictive models varying during the follow-up time, and the two dotted lines represent the 95% confidence intervals.
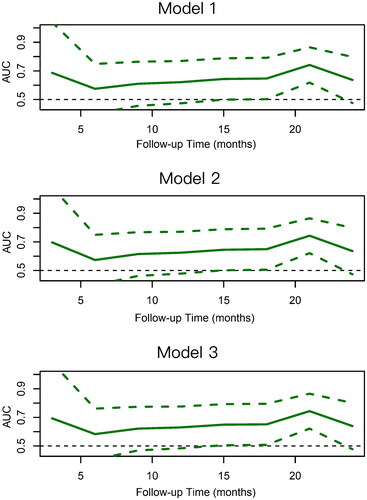
Table 4. Multivariable Analyses for the prediction of the Endpoint in patients after kidney transplantation.
Data availability statement
Any inquiries toward the datasets generated and/or analyzed during the current study can be directed to the corresponding authors.