
Figures & data
Figure 1. Study flow diagram.
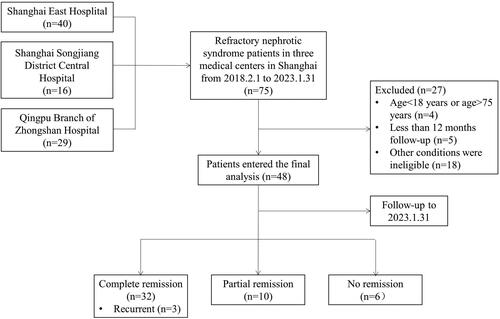
Table 1. Baseline characteristics of study population before rituximab therapy.
Figure 2. The efficacy outcome in the 12-month follow-up. Histogram showed the percentage of patients who reached PR, CR, or NR. (A) outcome of all patients. (B) outcome of patients with podocytopathy (MCD and FSGS). (C) outcome of patients with MN. *p < 0.05 complete remission rates compared to baseline. PR: partial remission; CR: complete remission; NR: no response; MCD: minimal change disease; FSGS: focal and segmental glomerulosclerosis; MN: membranous nephropathy.
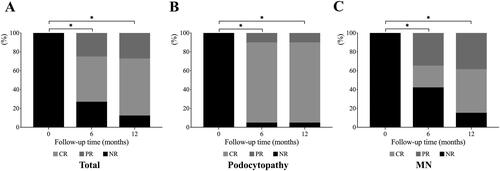
Figure 3. The independent Prognosis factors of complete remission in patients with MN receiving rituximab. The forest plot of Cox proportional hazard analysis showed the results of multivariate Cox proportional hazard analysis on the prognosis factors of complete remission in patients with MN receiving rituximab. BMI: body mass index; MAP: mean arterial pressure; eGFR: estimated glomerular filtration rate; Hb: hemoglobin. 95% CI: 95% confidence interval; HR: hazard ratio. p < 0.05 was considered to be statistically significant.
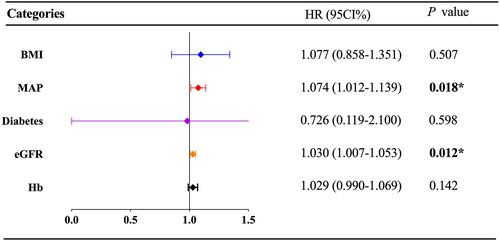
Figure 4. Kaplan–Meier curves for the complete remission after Rituximab in patients with MN and podocytopathy. Kaplan–Meier curves were shown for the proportion of cumulative complete remission during the follow-up period in patients receiving Rituximab with membranous nephropathy (MN) compared with the patients in podocytopathy group. 95% CI: 95% confidence interval; HR: hazard ratio. p < 0.05 was considered to be statistically significant.
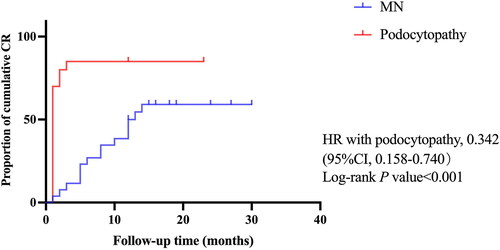
Table 2. Prognosis factors of complete remission in patients with MN receiving rituximab based on the results of univariate Cox proportional hazard analysis.
Table 3. Adverse events of rituximab during follow-up.