
Figures & data
Table 1. Baseline characteristics of the four groups.
Figure 1. Comparison of 28-day (left panel) and 90-day mortality (right panel) among four groups. Quartile 1: MAP < 67.3 mmHg; Quartile 2: 67.3 ≤ MAP < 76.7 mmHg; Quartile 3: 76.7 ≤ MAP < 86.3 mmHg; Quartile 4: MAP ≥ 86.3 mmHg.
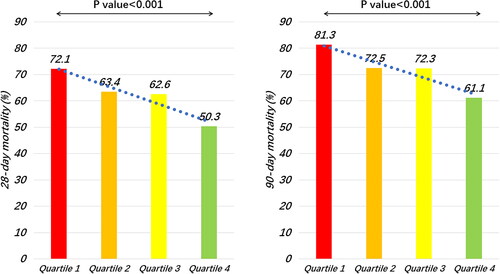
Figure 2. Kaplan–meier analysis of mean arterial pressure and 28-day (left panel) and 90-day (right panel) mortality. Quartile 1: MAP < 67.3 mmHg; Quartile 2: 67.3 ≤ MAP < 76.7 mmHg; Quartile 3: 76.7 ≤ MAP < 86.3 mmHg; Quartile 4: MAP ≥ 86.3 mmHg.
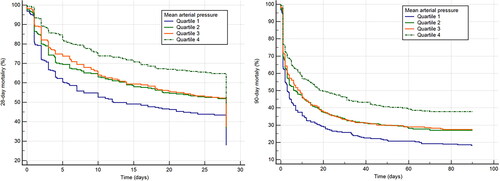
Table 2. Univariable Cox proportional hazard regression analysis associated with 28 - and 90-day mortality.
Figure 3. Lasso regression analysis associated with 28-day mortality.
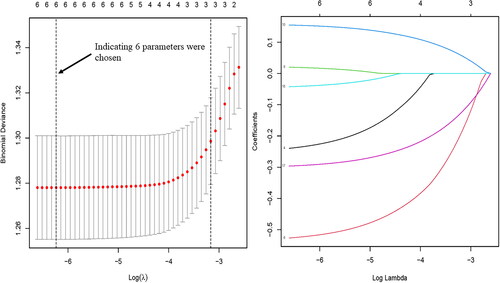
Figure 4. Lasso regression analysis associated with 90-day mortality.
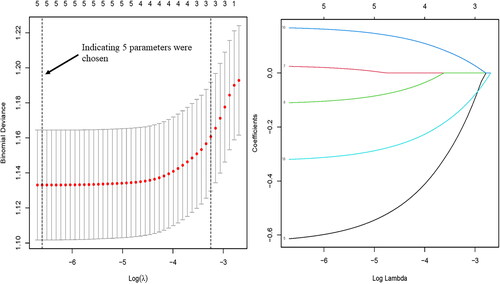
Figure 5. Independent association of MAP with 28-day (left panel) and 90-day (left panel) mortality. Quartile 1: MAP < 67.3 mmHg; Quartile 2: 67.3 ≤ MAP < 76.7 mmHg; Quartile 3: 76.7 ≤ MAP < 86.3 mmHg; Quartile 4: MAP ≥ 86.3 mmHg.
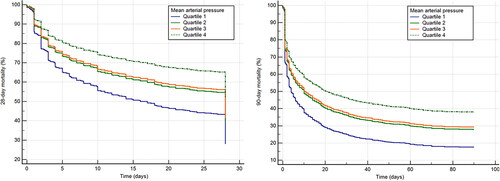
Figure 6. Restricted cubic splines illustrate the outcomes, demonstrating a non-linear association between MAP and both 28-day and 90-day mortality with and without accounting for potential confounding factors. MAP: mean arterial pressure. Hypertension, continuous renal replacement therapy cause, Charlson comorbidity index, acute kidney injury cause, and phosphate were adjusted in the adjusted model of 28- mortality. Hypertension, Charlson comorbidity index, acute kidney injury cause, and phosphate were adjusted in the adjusted model of 90- mortality.
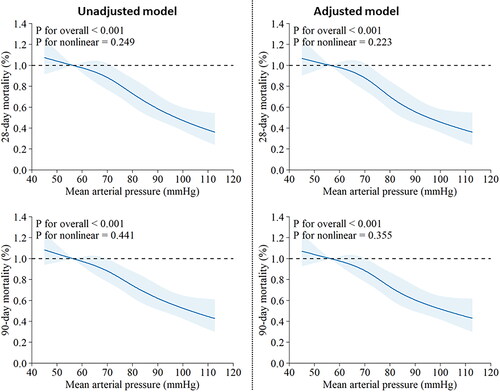
Table 3. Multivariable Cox proportional hazard regression analysis associated with 28 - and 90-day mortality.
Data availability statement
All the data can be freely downloaded from public databases (https://datadryad.org/).