
Figures & data
Figure 1. Flowchart of the study cohort.
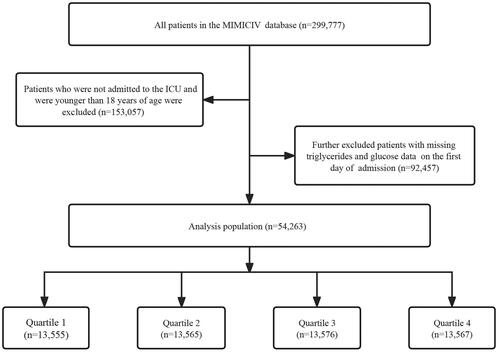
Table 1. Baseline characteristics of critical patients grouped according to TyG index quartiles.Table Footnotea
Table 2. Univariate logistic regression analysis of incidence rate of acute renal failure.
Table 3. Multivariate logistic regression analyses of TyG index and incidence of acute kidney failure.
Table 4. Effect size of TyG index on the incidence of acute kidney failure in each subgroup.
Figure 2. Linear dose-response relationship between triglyceride-glucose index and incidence of acute kidney failure. Adjustment factors included sex, age, race, glucose, triglycerides, hemoglobin, lymphocytes, neutrophils, platelet count, potassium, red blood cells, serum creatinine, sodium, urea nitrogen, white blood cells, acute myocardial infarction, atrial fibrillation, cerebral infarction, chronic kidney disease, diabetes, heart failure, hyperlipidemia, hypertension, and respiratory failure. The black line and pink line represent the estimated values and their corresponding 95% confidence intervals, respectively.
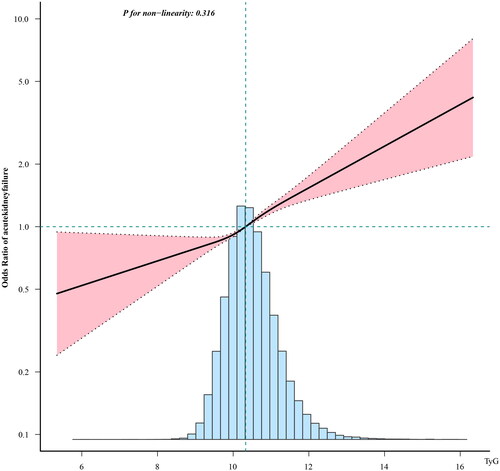
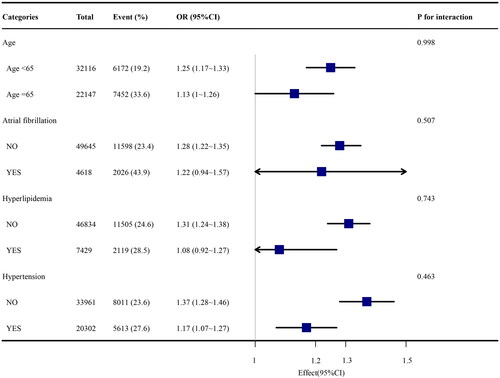
Figure 3. Subgroup analysis of the TyG index and acute renal failure.
Data availability statement
The dataset generated and analyzed in this study can be obtained from the authors upon reasonable request.