
Figures & data
Figure 1. COS administration protects against AKI induced by renal I/R injury. (A) H&E staining was used to assess renal histological morphology at 2 days after reperfusion. Arrows show intraluminal necrotic cells. Scale bar represents 50 μm. (B) Tubular injury scores were quantified and analyzed based on H&E staining. Values are mean ± SEM, results are representative of five animals in each group. (C) Concentrations of serum Cr were measured at 2 days after reperfusion (mean ± SEM, n = 8). (D) Immunohistochemical staining of KIM-1. Scale bar represents 50 μm.
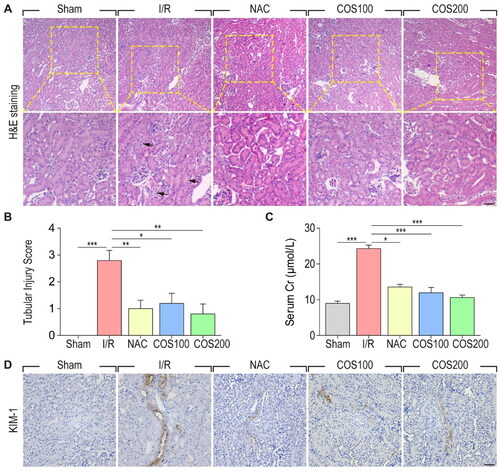
Figure 2. COS administration inhibits ER stress caused by I/R injury. (A) Immunohistochemical staining of GRP78. Scale bar represents 50 μm. (B) Immunohistochemical staining of CHOP. Scale bar represents 50 μm. (C) The expression of GRP78 and CHOP were analyzed with Western blotting at 2 days after reperfusion. β-tubulin was used as loading control (mean ± SEM, n = 8). (D) mRNA expression of CHOP relative to GAPDH (mean ± SEM, *p < 0.05, n = 8).
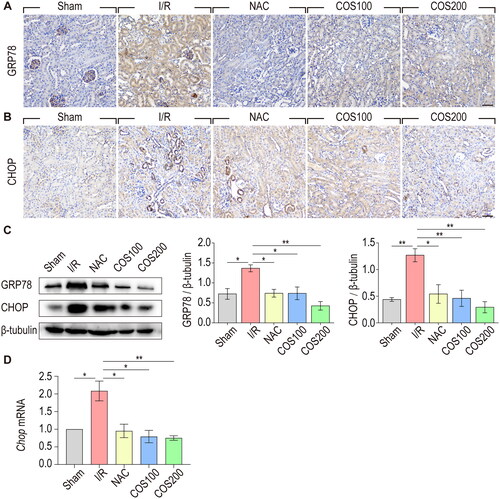
Figure 3. COS administration inhibits ER stress in TCMK-1 cells treated with TBHP. (A) Immunofluorescent staining of GRP78 in TCMK-1 cells. Scale bar represents 20 μm. (B) The expression of GRP78, CHOP and ATF-4 in TCMK-1 cells were analyzed with Western blotting. β-tubulin was used as loading control (mean ± SEM, n = 8).
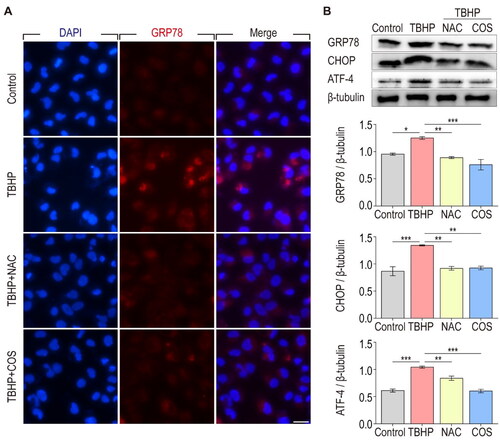
Figure 4. COS administration alleviates oxidative damage of TCMK-1 cells induced by TBHP. (A) Fluorescence microscopy detection of ROS generation by DCFH-DA. Scale bar represents 50 μm. (B) ROS levels in TCMK-1 cells were analyzed (mean ± SEM, n = 8). (C) MMP was detected using a JC-1 MMP assay Kit and images was captured. (D) The red to green fluorescence ratio was analyzed by image J (mean ± SEM, n = 8).
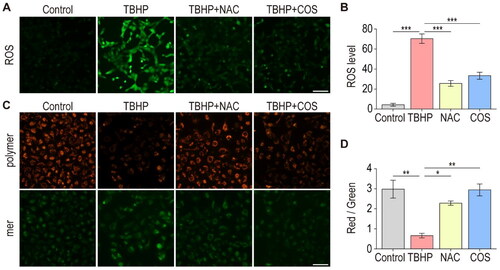
Figure 5. COS administration attenuates renal interstitial fibrosis at 2 months after renal I/R injury. (A) Renal morphology was examined with H&E staining. Areas bordered by yellow dotted line shows the pathological changes in kidney. Scale bar represents 50 μm. (B) Renal interstitial fibrosis was detected using Masson trichome staining. Arrows show extracellular matrix deposition around renal tubules. Scale bar represents 50 μm. (C) Immunohistochemical staining of α-SMA. Scale bar represents 50 μm. (D) IHC analysis of Collagen I in kidney tissues. Scale bar represents 50 μm. (E-F) mRNA expression of Collagen I and Fibronectin relative to GAPDH (mean ± SEM, *p < 0.05, n = 8).
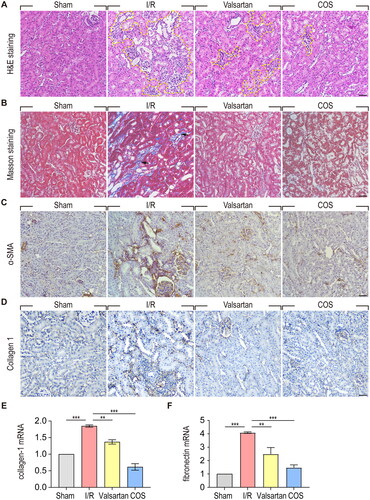
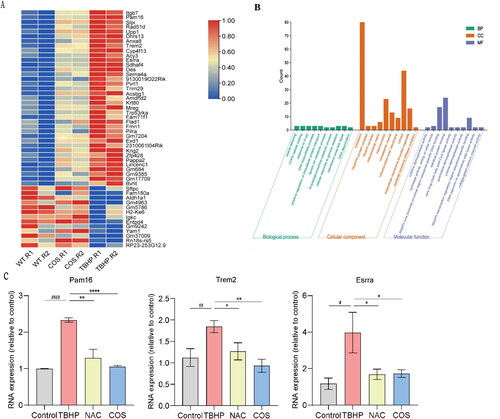
Figure 6. RNA-seq analysis Identifies gene expression profile regulated by COS. (A) Heatmap shows differential gene expression profiles, with upregulation in red, downregulation in blue. (B) Gene ontology (GO) function analysis histogram. BP is marked by dark cyan, CC is marked by sienna and MF is marked by steel blue. The bar chart was constructed through the bioinformatics platform. (C) mRNA expression of Pam16, Trem2 and Esrra relative to GAPDH (mean ± SEM, *p < 0.05, n = 8).
Data availability statement
The data that support the findings of this study are available upon request from the corresponding author.