
Figures & data
Figure 1. Flow chart of the study.
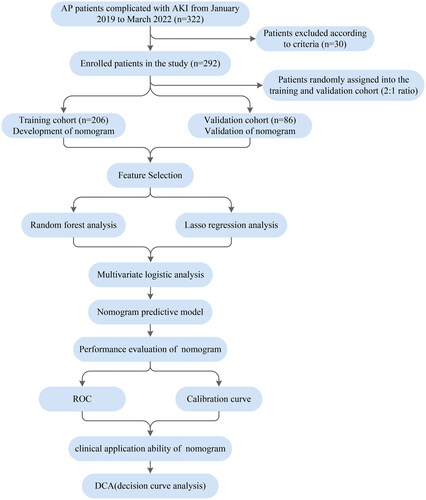
Table 1. Baseline characteristics of ARDS and non-ARDS patients in AP patients complicated with AKI.
Table 2. Baseline characteristics of ARDS and non-ARDS patients in the training cohort.
Table 3. Baseline characteristics of ARDS and non-ARDS patients in the validation cohort.
Figure 2. Screening predictors of ARDS using lasso regression. (A) LASSO coefficient profiles of the candidate predictors. (B) Selection of the optimal penalization coefficient.
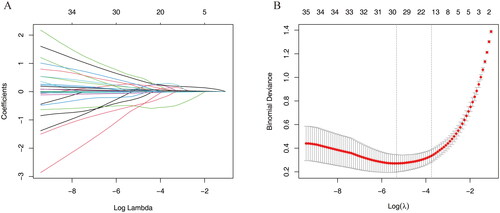
Figure 3. Selecting predictors of ARDS using random forest algorithm. (A) The boxplot shows the importance of each factor in the random forest algorithm. Boxplots in green, yellow, and blue were confirmed as important, tentative, and unimportant variables, respectively. (B) Decisions of rejecting or accepting features by random forest in 500 boruta function runs.
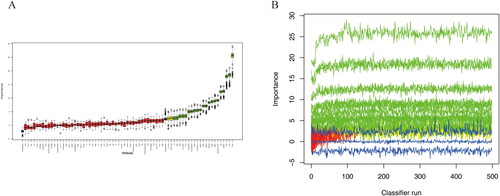
Figure 4. Multivariate logistic regression analysis. (A) The venn map used to illustrate the common predictors of ARDS. (B) Independent predictors assessed by multivariate logistic regression.
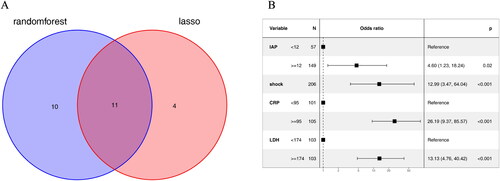
Figure 5. Nomogram predicting the probability of ARDS in AP patients complicated with AKI. Mark the individual’s value of each variable and obtain the points for each risk factor by drawing a vertical line from the variable axis to the “Points” axis. Then, cumulate the scores sum of all variables to obtain the total point. Finally, the probability of ARDS is obtained by drawing a vertical line from the “Total points” axis to “Risk” axis.
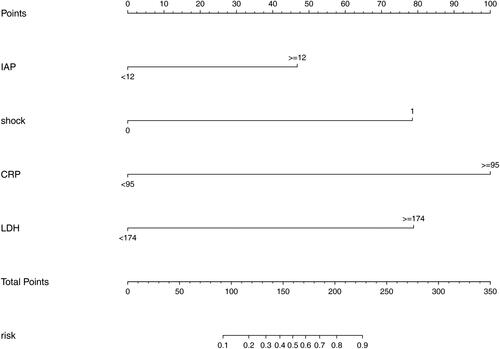
Figure 6. ROC curves and calibration curves of the nomogram. (A) ROC curve in the training cohort; (B) ROC curve in the validation cohort. (C) Calibration curve of the training cohort. (D) Calibration curve of the validation cohort.
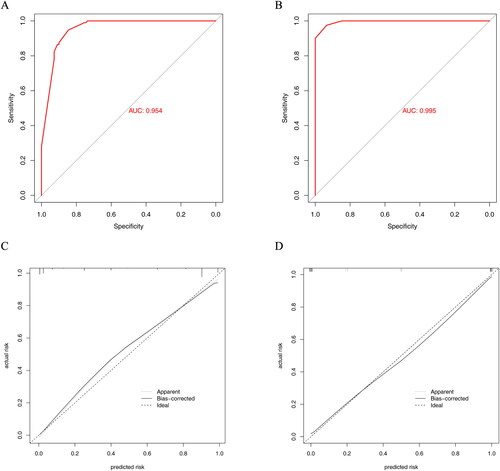
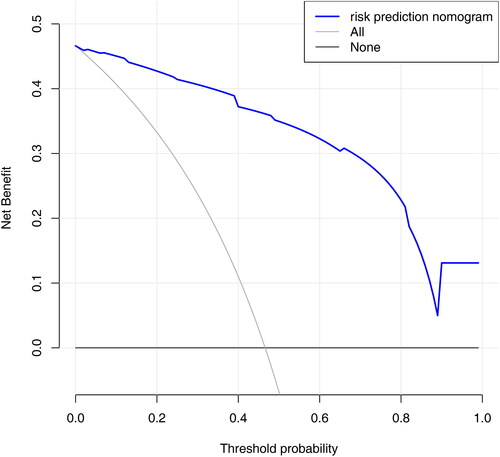
Figure 7. Decision curve analysis for the nomogram.
Data availability statement
The datasets used in the current study are available from the corresponding author if required.