
Figures & data
Figure 1. Flow diagram of patient selection. IMN: idiopathic membranous nephropathy.
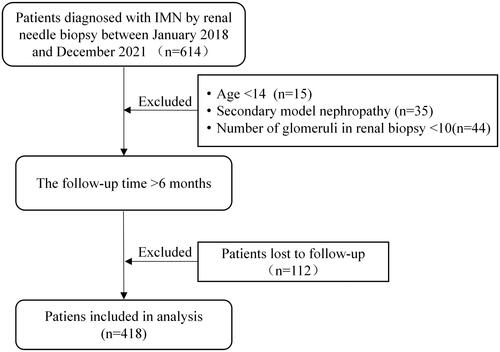
Figure 2. The model prediction workflow. IMN, idiopathic membranous nephropathy; Adverse events: relapse, ESRD (estimated glomerular filtration rate <15 mL/(min×1.73 m2) or dialysis or kidney transplantation), or doubling of serum creatinine.
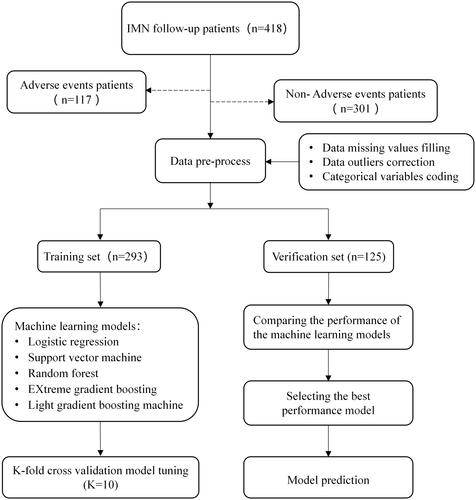
Table 1. Baseline clinical and pathological characteristics of the included patients.
Figure 3. Feature selection results based on the recursive feature elimination.
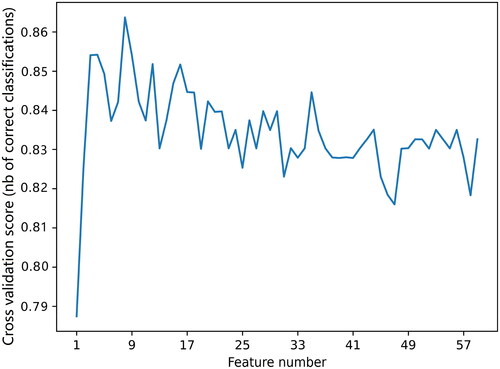
Figure 4. Evaluation of the predictive models. (a) The average ROC curves from five models in the validation set. Mean AUC values with standard deviations of different prediction models were shown in the box. (b) The average precision–recall (PR) curves, indicating the tradeoff between precision and recall. Mean AP values with standard deviations of different prediction models were shown in the box. AUC: area under the curve; ROC: receiver operating characteristic; AP: average precision; LightGBM: light gradient boosting machine; RF: random forest; XGBoost: eXtreme gradient boosting; SVM: support vector machine; LR: logistic regression.
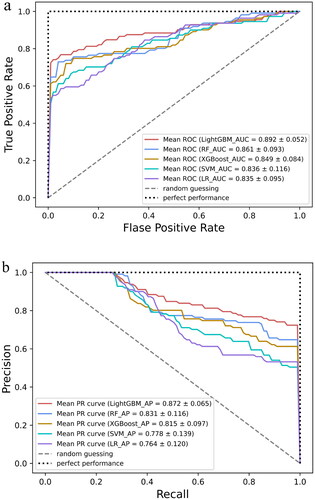
Table 2. Performance of the prediction models generated by the five machine learning models.
Figure 5. (a) Importance matrix plot of the LightGBM model. (b) SHAP summary plot of the nine clinical and pathological features of the LightGBM model. There is one dot per patient per feature colored according to an attribution value, where red represents a higher value and blue represents a lower value. anti-PLA2R: anti-phospholipase A2 receptor; IHC IgG4: immunohistochemical immunoglobulin G4; D-DIMER: D-dimer; TG: triglyceride; ALB: significantly lower serum albumin; AST: aspartate transaminase; BMG: β2-microglobulin; SCr: serum creatinine; FPG: fasting plasma glucose.
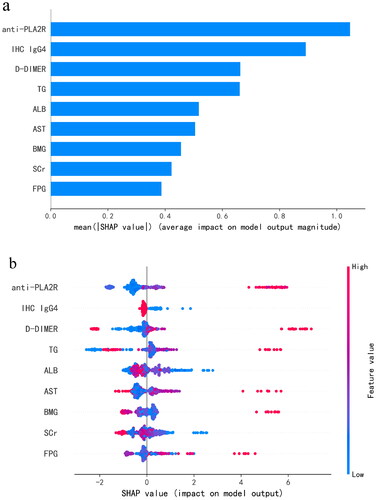
Figure 6. SHAP dependence plot of the LightGBM model, depicting how a single variable affects the prediction. SHAP value for specific features that exceed zero indicates an increased risk of patients experiencing adverse events. (a) SHAP dependence plot of anti-PLA2R. (b) SHAP dependence plot of IHC IgG4. The value 0 of IHC IgG4 represents (–), 0.5 represents (±), 1 represents (+), 2 represents (++), and 3 represents (+++). anti-PLA2R: anti-phospholipase A2 receptor; IHC IgG4: immunohistochemical immunoglobulin G4.
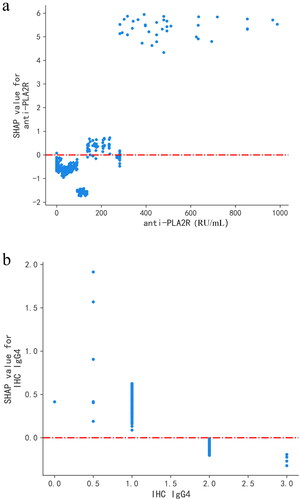
Figure 7. Predictive effect of LightGBM model using anti-PLA2R and IHC IgG4. 0: non-adverse events; 1: adverse events. The value 0 of IHC IgG4 represents (–), 0.5 represents (±), 1 represents (+), 2 represents (++), and 3 represents (+++). anti-PLA2R: anti-phospholipase A2 receptor; IHC IgG4: immunohistochemical immunoglobulin G4.
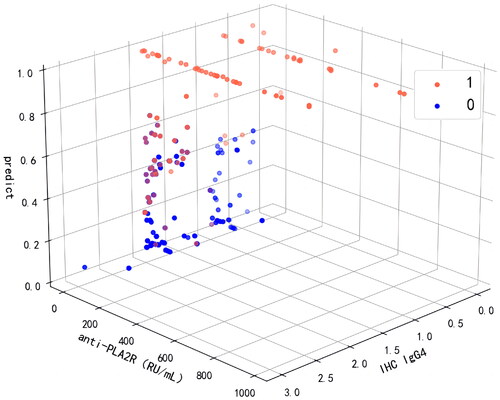
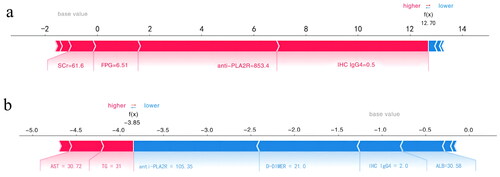
Figure 8. SHAP force plot of LightGBM model, explaining combined event risk for two example individuals. (a) A high-risk patient experiencing adverse events. (b) A low-risk patient experiencing adverse events. Variables in the red arrow mean the impact values are positive while blue means negative. The length of the arrow bar represents the absolute value of the impact. The value 0.5 of IHC IgG4 represents (±), 2 represents (++). anti-PLA2R: anti-phospholipase A2 receptor; IHC IgG4: immunohistochemical immunoglobulin G4; D-DIMER: D-dimer; TG: triglyceride; ALB: significantly lower serum albumin; AST: aspartate transaminase; SCr: serum creatinine; FPG: fasting plasma glucose.
Supplemental Material
Download PDF (193.6 KB)Data availability statement
The data supporting the findings of this study cannot be disclosed due to the need to protect patients’ privacy, but are available from the corresponding author, Dr. Zhou [[email protected]].