
Figures & data
Table 1. Baseline characteristics of participants who were Still alive vs. those who were deceased by December 31, 2015.
Table 2. Baseline characteristics of participants according to the PNI group.
Figure 1. Kaplan–meier survival estimates for the PNI groups.
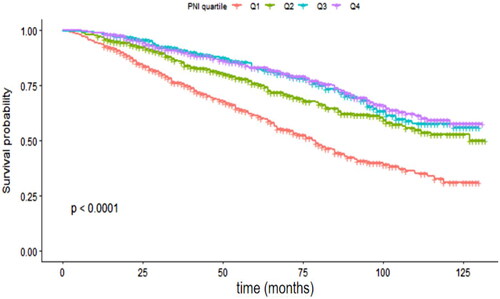
Table 3. Relationship between prognostic nutritional index and all-cause mortality in different models.
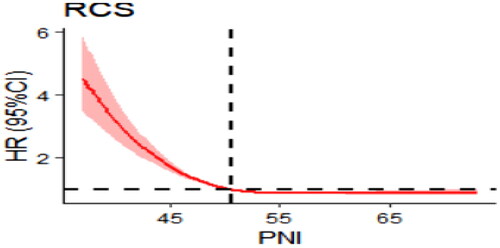
Figure 2. Restricted cubic spline for the association between the PNI and all-cause mortality.
Supplemental material