
Figures & data
Table 1. Primers used for qRT–PCR.
Figure 1. Increased osteoclasts and bone loss in adenine-induced ROD model. (A) Bone histomorphometry data. BV/TV, bone volume/tissue volume; BFR/BS, bone formation rate; Oc.S/BS, osteoclast surface per millimeter bone perimeter; N.Oc/BS, osteoclast number per millimeter bone perimeter; OS/BS, osteoid surface/bone surface; MAR, mineral apposition rate; MLT, mineralization lag time. n = 12-15 per group, ***p < 0.001 or as indicated, student’s t-test. (B) Representative micro-computed tomography images of distal femurs of NC and ROD rats.
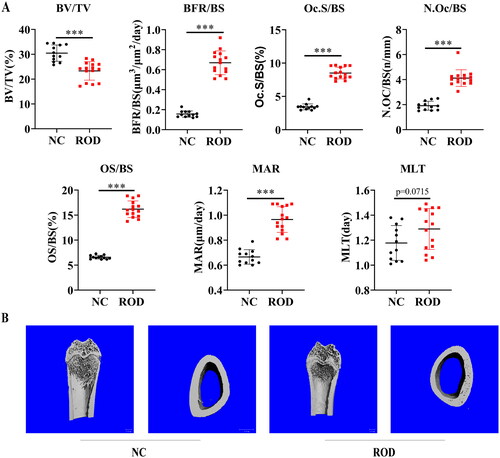
Table 2. Serum biochemical parameters of rats.
Figure 2. Increased proinflammatory cytokines in BM supernatant and BMMs of ROD rats. (A) ELISA was used to detect the concentrations of IL-1β, IL-6, and TNF-α in the BM supernatant of rats. (B) BMMs from NC or ROD rats were cultured for 24 h followed by RT–PCR of IL-1β, IL-6, and TNF-α. (C) ELISA was used to detect the concentrations of IL-1β, IL-6, and TNF-α in the BMM supernatants of rats in the two groups. (D) BMMs from NC or ROD rats were cultured for 24 h followed by RT–PCR of NF-κB1 and IκB. Data represent the mean ± SD, n = 6 per group, ***p < 0.001, **p < 0.01, *p < 0.05.
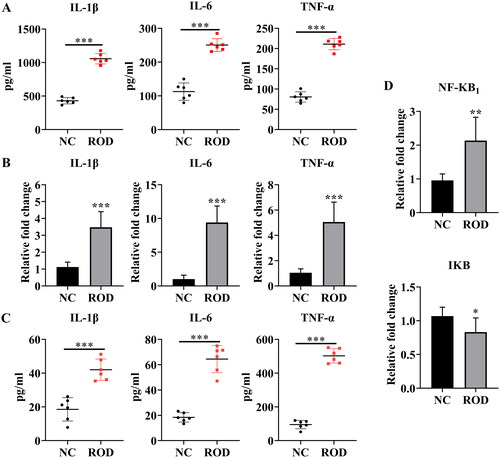
Figure 3. Effect of ROD-Exos on the proinflammatory activity of BMMs. (A) Transmission electron microscope images of Exos. (B) Western blot for exosome-associated proteins TSG101 and CD9. (C) The size distribution of Exos was measured by dynamic light scattering. (D, E) BMMs were treated with PBS, NC-Exos or ROD-Exos for 36 h followed by qRT–PCR of IL-1β, IL-6, TNF-α, NF-κB1, and IκB. Data represent the mean ± SD, n = 3, ***p < 0.001, **p < 0.01, *p < 0.05. (F) PKH26-labeled BM-Exos were cultured with BMMs for 12 h, and uptake was observed using laser confocal microscopy. Blue, DAPI-stained nuclei; red, PKH26-labeled Exos.
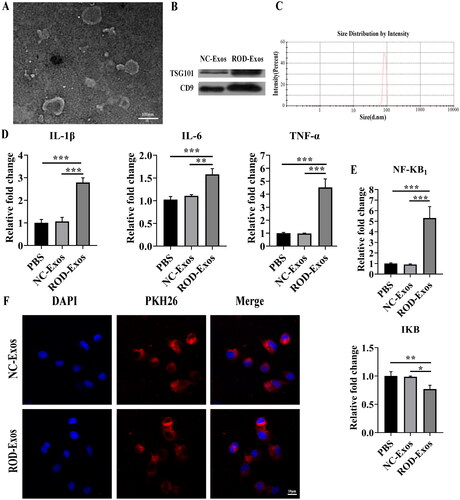
Figure 4. Effect of ROD-Exos on osteoclast differentiation of BMMs. (A) Primary BMMs (1 × 10⁵/mL) were cultured with M-CSF and RANKL for 4 days followed by TRAP staining. TRAP+ cells with three or more nuclei (black arrows in panel A) were defined as osteoclasts. Magnification: 100×. (B) Normal primary BMMs (1 × 10⁶/mL) were cultured with M-CSF and RANKL and treated with PBS, NC-Exos or ROD-Exos for 6 days followed by TRAP staining. The number of TRAP+ cells with three or more nuclei (black arrows in panel B) was counted. Magnification: 200×. (C) BMMs were cultured with M-CSF and RANKL and treated with PBS, NC-Exos or ROD-Exos for 3 days followed by qRT–PCR of osteoclast-specific genes (MMP-9 and CTSK). Data represent the mean ± SD. n = 6 per group (A); n = 3 per group (B, C). ***p < 0.001,**p < 0.01, *p < 0.05.
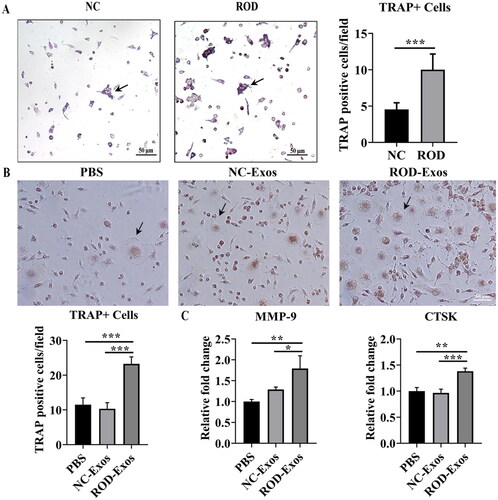
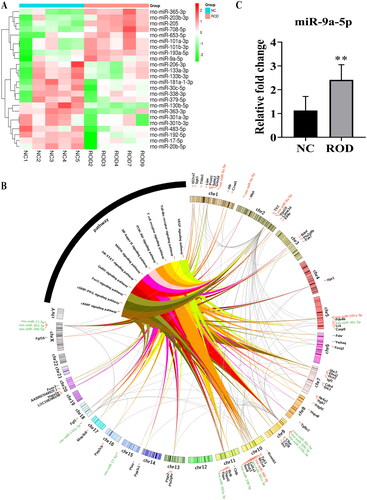
Figure 5. Profiles for differentially expressed miRNAs. (A) Heatmap of differentially expressed miRNAs between NC-Exos and ROD-Exos. n = 5. (B) The circos plot showing the miRNA-mRNA-pathway network. Red represents upregulated miRNAs, green represents downregulated miRNAs, and black represents target mRNAs. (C) qRT–PCR showing upregulation of miR-9a-5p expression in ROD-Exos. Data represent the mean ± SD, n = 6, **p < 0.01.
Supplemental Material
Download MS Excel (14.8 KB)Data availability statement
All data generated or analyzed during this study are included in this article. Further inquiries can be directed to the corresponding author.