
Figures & data
Figure 1. Flow chart-including patient enrollment and outcomes.
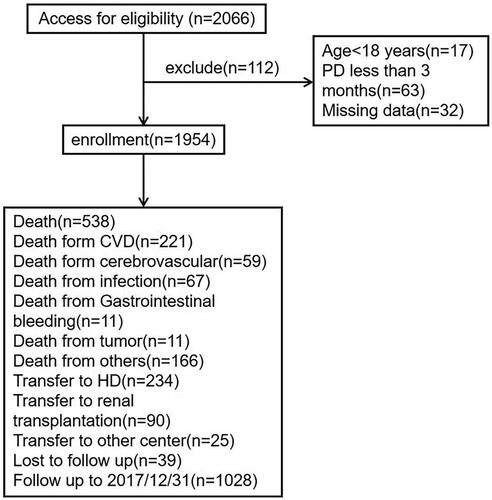
Figure 2. Restricted-cubic-spline plot of the association between albumin to non-HDL-C ratio and all-cause mortality. The median albumin to non-HDL-C ratio was 10.8.
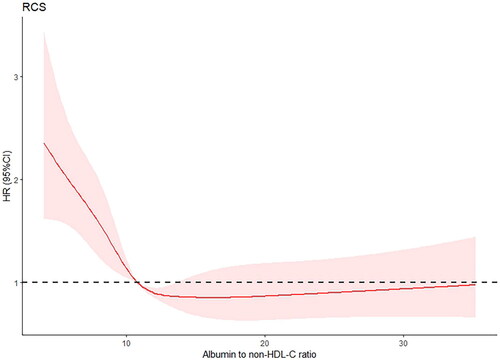
Table 1. Baseline characteristics of the study population.
Figure 3. The Kaplan–Meier curves with all-cause mortality by category of the level of albumin to non-HDL-C ratio. The curves were constructed using the Kaplan–Meier method and compared using the Mantel-Cox log-rank test. Patients in the highest albumin to non-HDL-C ratio group (albumin to non-HDL-C ratio > 12.79) had a lower risk of all-cause mortality. Log-rank test of lowest vs. moderate, lowest vs. highest, and moderate vs. highest, was 24.35 (p < 0.001), 36.03 (p < 0.001), and 1.124 (p = 0.288), separately.
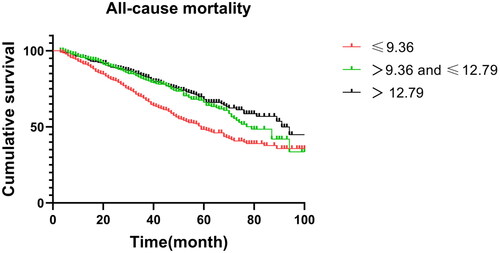
Table 2. Albumin to non-HDL-C ratio predicts the prognosis of all-cause mortality in PD patients.
Figure 4. A: ROC curves of 3 indicators: albumin/non-HDL-C, non-HDL-C, albumin. The areas under the ROC curve (AUC) of albumin/non-HDL-C, non-HDL-C, albumin were 0.604 (p < 0.001), 0.583 (p < 0.001), and 0.552 (p < 0.001), respectively. B: ROC curves of 4 indicators: albumin/non-HDL-C, hs-CRP, BMI, and nPCR. The areas under the ROC curve (AUC) of albumin/non-HDL-C, hs-CRP, BMI, and nPCR were 0.523 (p = 0.123), 0.502 (p = 0.907), and 0.609 (p < 0.001), respectively.
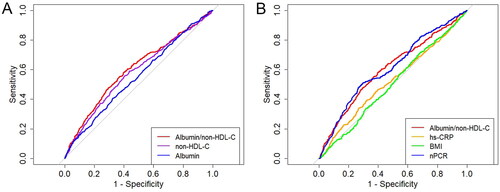
Figure 5. Competitive risk models. Estimated cumulative incidence curves between the all-cause mortality and other competing events for each albumin to non-HDL-C ratio group. The cumulative incidence curves for different albumin to non-HDL-C ratio groups are highly significant for the all-cause mortality (p < 0.001), while there is no statistical significance for the occurrence of other competing events (being transferred to hemodialysis therapy, being transferred to kidney transplantation, being transferred to other centers).
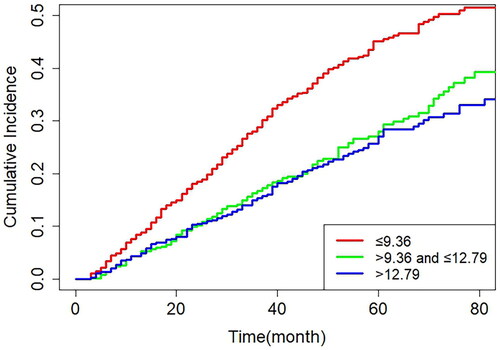
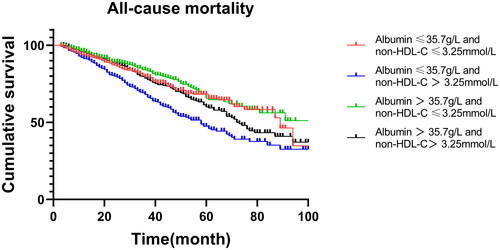
Figure 6. Sensitivity analyses. The whole cohort was categorized into four groups by the median values of non-HDL-C (3.25 mmol/L) and albumin (35.7 g/L). The repeated Kaplan-Meier curves showed the statistical significance of the association between the redefined groups and all-cause mortality (p < 0.001).
Supplemental Material
Download PDF (348.4 KB)Data availability statement
All data generated or analyzed during this study are included in this published article.