
Figures & data
Table 1. Basic clinical data of enrolled KTRs (n = 95).
Table 2. Change of relevant clinical and laboratory index after KT.
Figure 1. Prevalence of osteopenia and osteoporosis (%) at various skeletal sites (FN, femoral neck; LS, lumbar spine).
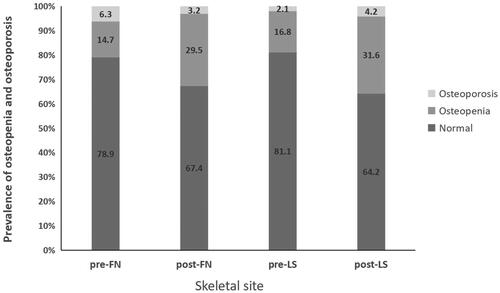
Table 3. Changes of metabolism biochemical markers and BMD after KT (n = 95).
Table 4. Changes of LV index after KT (n = 95).
Table 5. Results of logistic regression analysis of influencing factors of postoperative LVH (n = 95).
Table 6. Results of linear regression analysis of influencing factors of ΔLVMI (n = 95).
Table 7. Results of linear regression analysis of influencing factors of postoperative LVEF (n = 95).
Table 8. Results of linear regression analysis of influencing factors of ΔLVEF (n = 95).
Table 9. Results of logistic regression analysis of influencing factors of postoperative LV diastolic dysfunction (n = 95).
Data availability statement
Reasonable requests for data will be accommodated by contacting the corresponding author.