
Figures & data
Table 1. Summary of the clinical characteristics of the 11 PBC-PT patients.
Table 2. Detailed clinicopathological features and renal prognosis of the 11 PBC-PT patients.
Figure 1. PBC-PT patients presented with tubulointerstitial nephritis in kidney biopsy. (a) Focal interstitial inflammatory infiltrates with major components of lymphocytes and plasma cells were shown by HE staining (×100). (b) Enlarged boxed area in (a) (×400). (c) Proximal tubulitis characterized as inflammatory cell infiltration in proximal tubular epithelium (asterisks) was revealed by HE staining (×400). (d) Focal tubular atrophy was shown by periodic acid-silver metheramine staining (×100). (e) Focal interstitial fibrosis was indicated by masson trichrome staining (×100). (f) Swollen mitochondria with destroyed or disappeared cristae (arrows) in proximal tubular epithelium were shown by transmission electron microscopy (×5000). Abbreviations: PBC-PT, primary biliary cholangitis with proximal tubular dysfunctions; HE, hematoxylin and eosin staining.
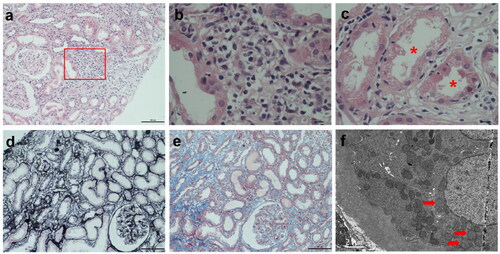
Figure 2. Long-term renal prognosis and eGFR improvements after GCs treatment in PBC-PT patients. Patients who had follow-up time less than three months (n = 2) and insufficient eGFR follow-up data (n = 1) were excluded. (a) Evolution of eGFR in the whole population of PBC-PT patients (n = 8 at baseline). (b–d) After receiving GCs treatment, PBC-PT patients (n = 6) showed improvements in serum IgM (p = 0.019), eGFR (p = 0.028) and Scr (p = 0.052) during follow-up. Abbreviations: IgM, immunoglobulin M; eGFR, estimated glomerular filtration rate; GCs, glucocorticoids; PBC-PT, primary biliary cholangitis with proximal tubular dysfunctions; mo, months; Scr, serum creatinine.
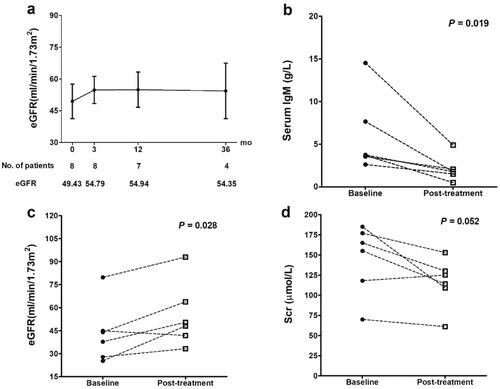
Table 3. Improvements of PT functions after GCs treatment in PBC-PT patients.
Supplemental Material
Download PDF (587.6 KB)Data availability statement
The data underlying this article are available in the article and in its online supplementary material.