
Figures & data
Table 1. Baseline Demographic characteristics and clinical data for the patients on HD and healthy controls.
Figure 1. Comparison of the global native T1 value between the HD group (n = 32) and the healthy control group (n = 14).
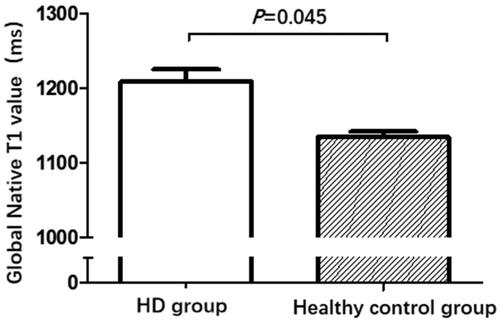
Figure 2. Comparison of native T1 values of left ventricular segments in the HD group (n = 32).
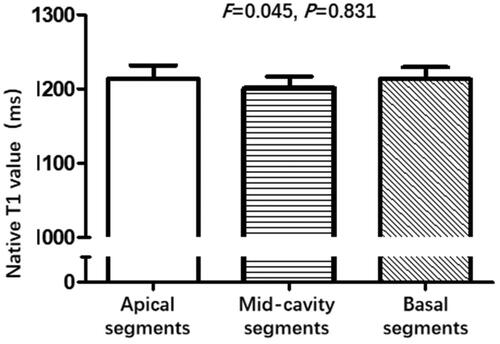
Figure 3. Graphs illustrate the correlation between the global native T1 value and laboratory, cardiac parameters in patients on HD. The correlation was analyzed between the global native T1 value and A, intact parathyroid hormone, B, left ventricular end-diastolic volume indexed to body surface area, C, left ventricular mass indexed to body surface area, and D, left ventricular ejection fraction.
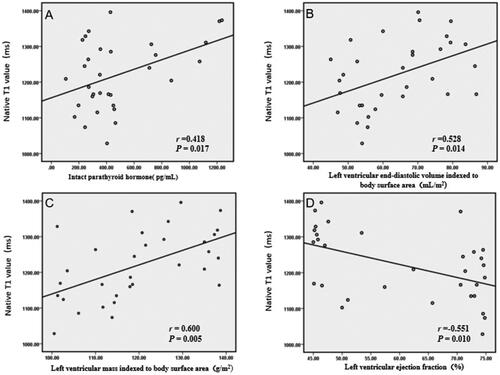
Table 2. Correlation analysis of the global native T1 value.