
Figures & data
Table 1. The clinical characteristics of patients.
Table 2. Pathological diagnosis of patients.
Figure 1. The hemoglobin levels, serum creatinine levels and urinary NAGL levels before and after the operation. The mean preoperative and postoperative hemoglobin of patients were 113.4 ± 24.1 g/L and 108.0 ± 27.9 g/L, respectively (B). The median preoperative and postoperative serum creatinine of patients were 304.2 (141.1, 569.7) μmol/L and 325.0 (171.6, 549.5) μmol/L, respectively (A). The median preoperative and postoperative urinary NAGL were 213.6 (52, 391.8) ng/ml and 192.1 (60.0, 325.0) ng/ml, respectively (C).
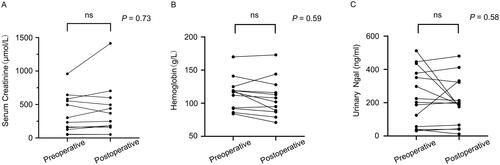
Figure 2. PRISMA flow chart of the literature search. PRISMA: Preferred Reporting Items for Systematic Reviews and Meta-Analyzes.
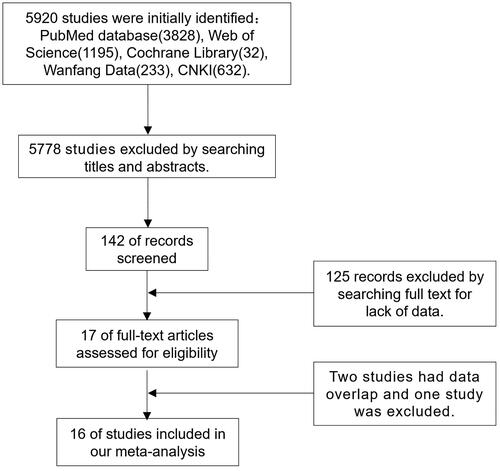
Table 3. Clinical characteristics and quality assessment of the included records.
Figure 3. The success rate of operation analyzed through the common effect model. The success rate of operation was 99.9%.
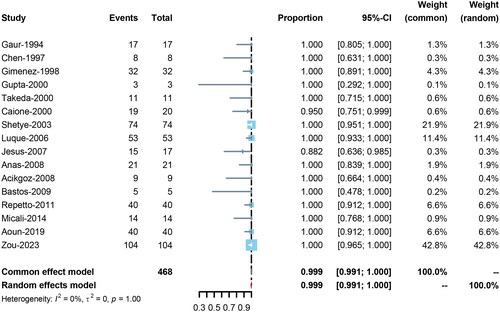
Figure 4. The satisfactory rate of sample analyzed through the common effect model. The satisfactory rate of sample was 99.1%.
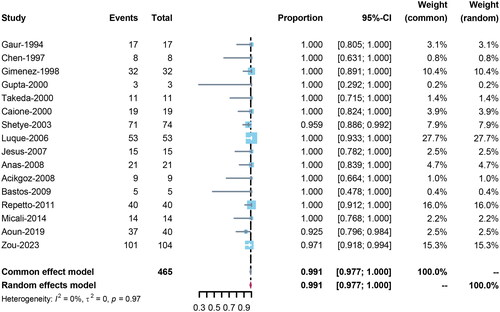
Figure 5. The complication rate of surgery analyzed through the common effect model. The complication rate of surgery was 2.6%.
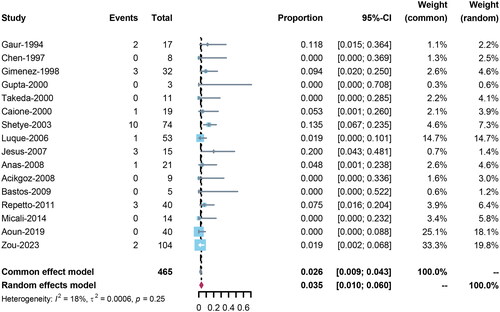
Table 4. The types and number of surgical complications of different studies.
Supplemental Material
Download PDF (2.1 MB)Data availability statement
The datasets used in this work are accessible upon reasonable request from the corresponding author.