
Figures & data
Figure 1. The flowchart of patients’ selection.
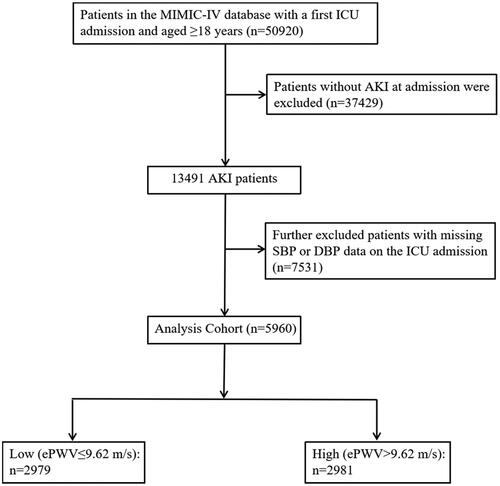
Table 1. Baseline characteristics of critical ill patients with AKI grouped according to ePWV.
Figure 2. Kaplan-Meier survival curves for in-hospital mortality among low ePWV group and high ePWV group.
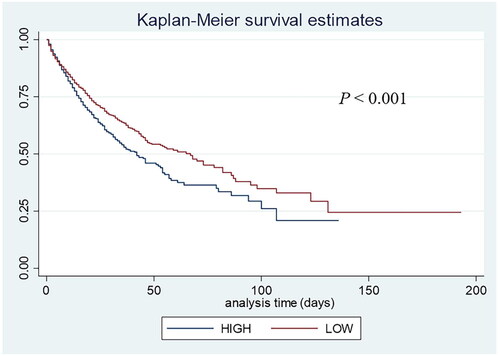
Figure 3. RCS curve for the ePWV hazard ratio and hospital mortality.
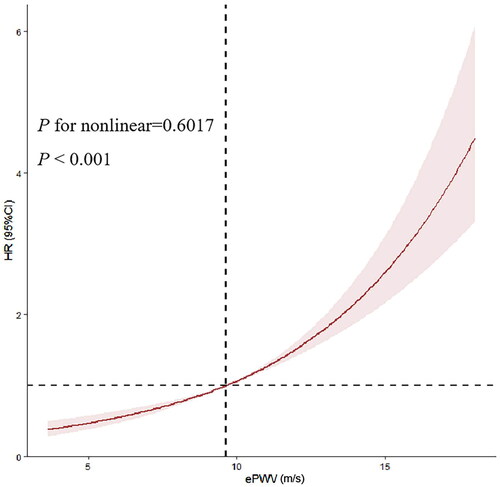
Table 2. Cox proportional HR for in-hospital mortality.
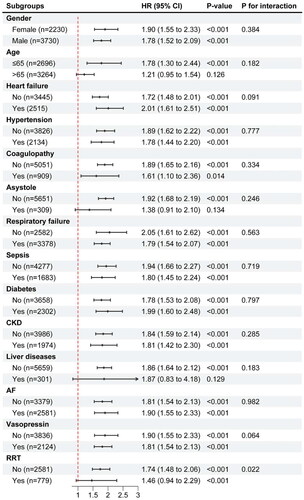
Figure 4. Forest plots for different subgroup analysis of HRs for the association between ePWV and in-hospital mortality.
Data availability statement
The data supporting the findings of this study are available from the first author upon reasonable request.