
Figures & data
Figure 1. Immunofluorescence findings in IgAN; A: Immunofluorescence microscopy image showing very bright (3+) granular deposits for IgA located in the mesangium of a glomerulus; B: Immunofluorescence microscopy image showing positive granular deposits (2+) for IgM predominantly located in the mesangium of a glomerulus.
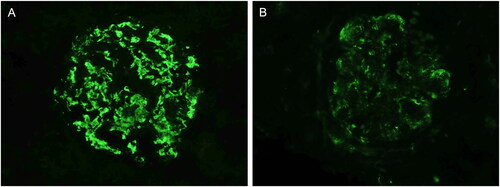
Table 1. Clinical and histopathological characteristics of all patients and a comparative analysis according to the presence or absence of IgM deposition in kidney biopsy.
Figure 2. Patients with mesangial IgM positivity at immunofluorescence had a shorter mean renal survival time: 90.3 (95%CI 78.8, 101.7) versus 116.1 (95%CI 103.3, 128.8) months.
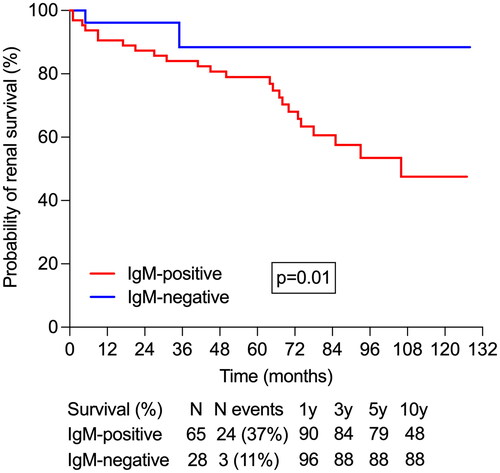
Table 2. Prediction of end stage kidney disease (ESKD) according to the IgM status on immunofluorescence and known risk factors of progression (univariate and multivariate Cox regression analysis).
Supplemental Material
Download PDF (153.9 KB)Data availability statement
The data underlying this article will be shared on reasonable request to the corresponding author.