
Figures & data
Figure 1. Identification of DEGs in transcriptome sequencing data. (A) PCA of sequencing results. (B) Volcano plot of the DEGs. (C) Heat map of the DEGs.
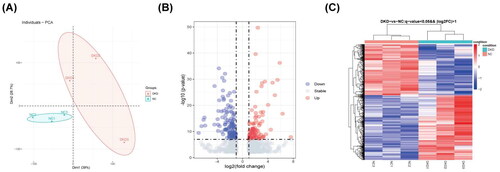
Figure 2. Functional enrichment analysis and pathway of DEGs. (A) KEGG enrichment analysis. (B) KEGG enrichment analysis in the lipid metabolism pathway. (C) PPI network analysis in the AA metabolism pathway. (D) GO enrichment analysis. (E) Bubble plot. (F) RT-PCR detection of ALOX12 mRNA in db/m and db/db mouse models, **p < .01. (G, H) The diagnostic efficacy of ALOX12 for DKD was verified using ROC curves in dataset GSE1009 and dataset GSE7253.
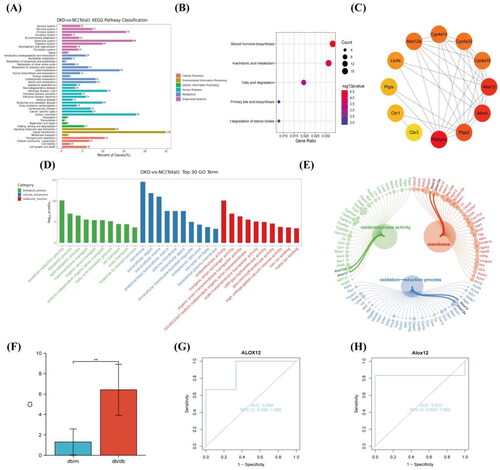
Figure 3. Pathological staining and ALOX12 expression in mouse kidney tissues. (A) H&E staining in db/m and db/db kidney tissue. (B) PAS staining in db/m and db/db kidney tissue. (C) IHC detection of NGAL protein expression in db/m and db/db kidney tissue. (D) IHC detection of ALOX12 protein expression in db/m and db/db kidney tissues. Scale bar = 50 μm. *p < .05, **p < .01.
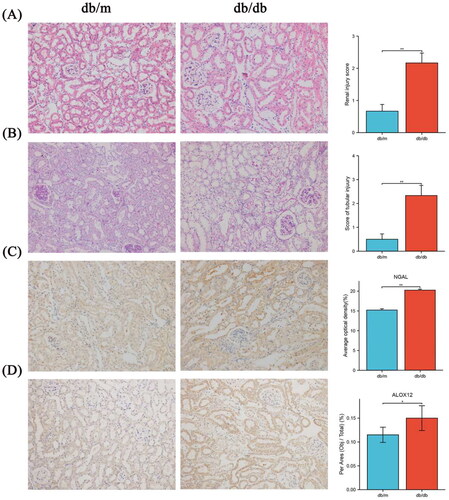
Figure 4. Expressions of ALOX12 in the body. (A) ALOX12 levels in serum. (B) ALOX12 levels in urine. *p < .05, **p < .01, and ***p < .001.
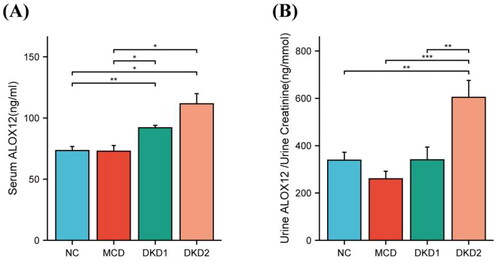
Table 1. Demographics of patients with hematuria.
Table 2. Baseline patient demographics and renal tissue ALOX12 protein expression.
Figure 5. Expression of ALOX12 protein in human kidney tissue. (A) IHC detection of NGAL protein expression in human kidney tissue. (B) IHC detection of ALOX12 protein expression in human kidney tissue. (C) Expression results of ALOX12 levels and NGAL levels. (D) Correlation analysis of ALOX12 levels with NGAL levels. (E) IF double staining of ALOX12 and specific tubular markers in renal biopsy tissues of patients with DKD. Scale bar = 50 μm. *p < .05, **p < .01, and ***p < .001.
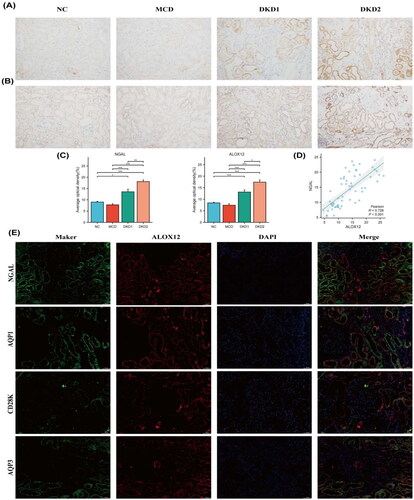
Table 3. Clinical data of patients with DKD.
Table 4. Pathological data of patients with DKD.
Table 5. Correlation analysis of renal tubular ALOX12 protein levels and clinical and pathological data.
Table 6. Binary logistic regression analysis.
Figure 6. ROC curve analysis to determining diagnostic value. Area under the ROC curve (95% confidence interval (CI)) for the presence of the AUC for macroalbuminuria.
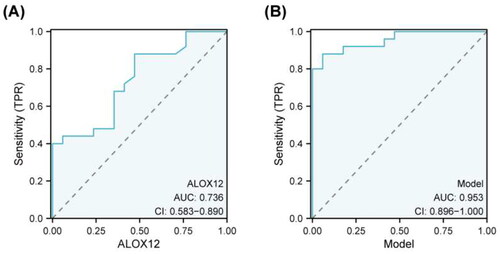
Table 7. ROC curve analysis.
Supplemental Material
Download PDF (76.4 KB)Data availability statement
The datasets used and/or analyzed during the present study are available from the corresponding author on reasonable request.