
Figures & data
Figure 1. Schematic flow diagram of inclusion and exclusion criteria for our study cohort.
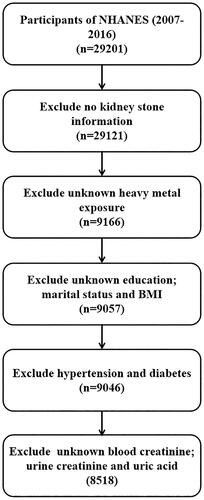
Table 1. Baseline characteristics of NHANES participants between 2007 and 2016 (n = 8518).Table Footnotea
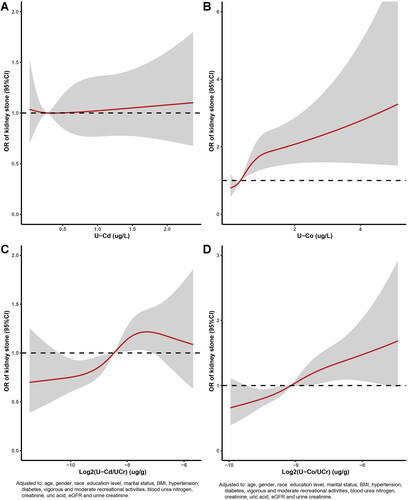
Figure 2. Relative risk for kidney stones based on U-Cd and U-Co level before PSM. The shaded areas represent upper and lower 95% CIs. Adjustment factors are as same as which presented in extended model 4. Restricted cubic spline (RCS) plot of the association between log2-transformed U-Cd/U-Cr and U-Co/U-Cr levels and kidney stones. The solid and dashed lines represent the odds ratios and 95% confidence intervals. (A) U-Cd; (B) U-Co; (C) log2-transformed U-Cd/U-Cr; (D) log2-transformed U-Co/U-Cr.
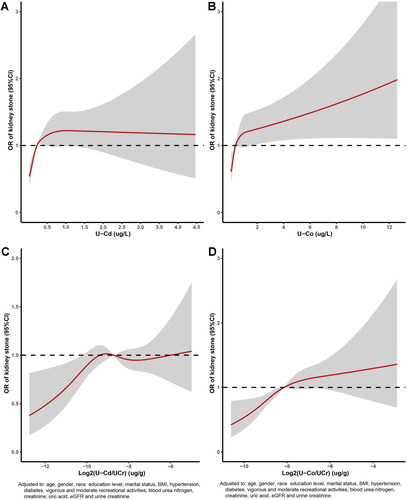
Figure 3. Adjusted odds ratios for associations between the U-Cd and U-Co and the presence of kidney stones in NHANES 2007–2016 before PSM. (A) U-Cd; (B) U-Co.
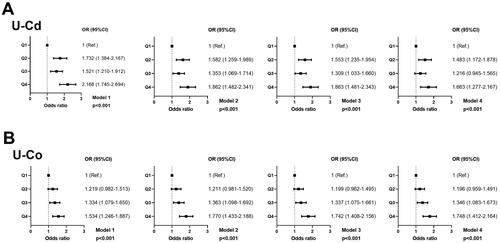
Figure 4. Distribution of propensity score before and after matching.
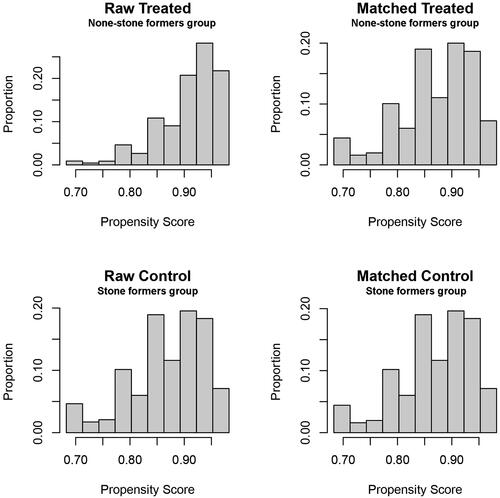
Table 2. Adjusted odds ratios for associations between the heavy metals and the presence of kidney stone in NHANES 2007–2016 before PSM.Table Footnotea
Figure 5. Relative risk for kidney stones based on U-Cd and U-Co level after PSM. The shaded areas represent upper and lower 95% CIs. Adjustment factors are as same as which presented in extended model 4. Restricted cubic spline (RCS) plot of the association between log2-transformed U–Cd/UCr and U–Co/UCr levels and kidney stones. The solid and dashed lines represent the odds ratios and 95% confidence intervals. (A) U-Cd; (B) U-Co; (C) log2-transformed U-Cd/U-Cr; (D) log2-transformed U-Co/U-Cr.
Supplemental Material
Download PDF (959.1 KB)Data availability statement
The data that support the findings of this study are available from the corresponding author upon reasonable request.