
Figures & data
Figure 1. Flow chart of the participants.
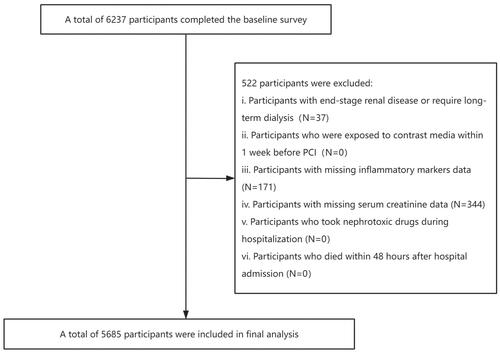
Table 1. Baseline variables in groups with high or low levels of SIRI.
Figure 2. Restricted cubic spline curve with logistic regression between SIRI score and CA-AKI.
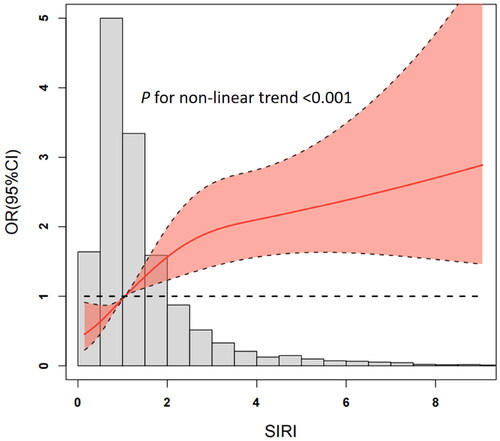
Figure 3. Subgroup analysis stratified by risk factors for contrast-associated acute kidney injury. CI, confidence interval.
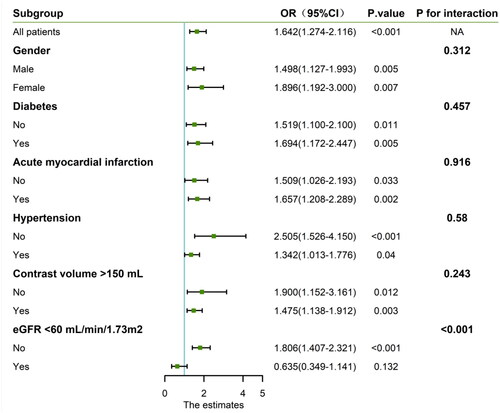
Table 2. Relationship of SIRI with CA-AKI and long-term mortality.
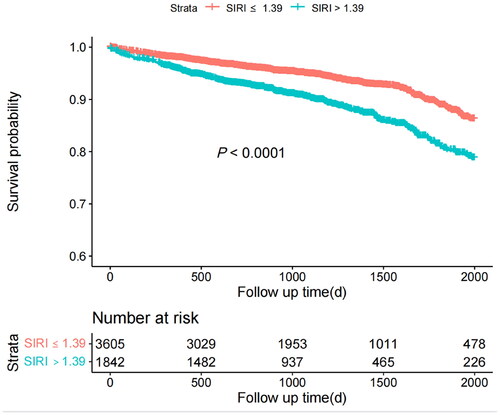
Figure 4. Associations between SIRI and long-term mortality. Solid lines indicate survival probability; shaded areas indicate confidence interval.
Supplemental material
Supplemental Material
Download PDF (192.5 KB)Data availability statement
The datasets used and/or analyzed in this study are available from the corresponding author upon reasonable request.