
Figures & data
Table 1. Specific primers for qRT-PCR.
Figure 1. Knockdown Circ1647 has been shown to attenuate renal fibrosis in a CKD model. (A,B) The level of Circ1647 was detected by qRT-PCR in CKD and the renal parenchyma cells. Data from animal experiments represent the mean ± SEM of six mice per group. Data from cell experiments represent the mean ± SEM of at least three independent experiments.*p < 0.01, **p < 0.005, ***p < 0.001.
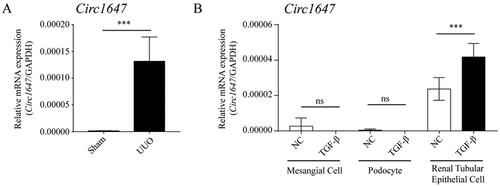
Figure 2. Knockdown of Circ1647 ameliorates renal tubular injury in UUO-induced mice. (A) Schematic illustrating the depletion strategy of Circ1647 employing specific sgRNA. (B,C) The level of Circ1647/LinearSh2d4b was detected by quantitative RT-PCR (qRT-PCR). (D) Representative micrographs of HE staining. Scale bar represents 50 μm. (E) Immunohistochemistry for KIM1. (F) HE staining of quantitative analysis the percentage of renal tubular necrosis. (G) Percentage of positive area of KIM1 immunohistochemical staining. (H,I) Serum levels of BUN (Blood Urea Nitrogen) and Scr (Serum Creatinine) were measured and quantitatively analyzed to evaluate renal function. (J–L) Detection of RNA and protein levels of KIM1 by qRT-PCR and immunoblotting. Data represent the mean ± SEM for six mice in each group. *p < 0.01, **p < 0.005, ***p < 0.001.
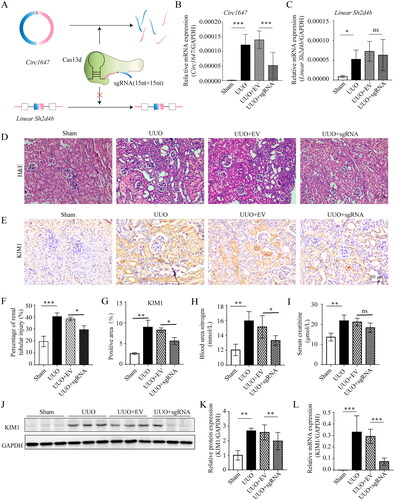
Figure 3. Efficacy of Circ1647 Knockdown in Reducing Renal Fibrosis in UUO-induced mice. (A) Masson’strichrome staining and quantitative analysis of the fibrotic area. Arrows highlight areas of significant collagen deposition. Scale bar represents 50 μm. (B) Immunohistochemistry for fibronectin, α-SMA and percentage of positive area. (C–E) Detection and relative quantification of fibronectin and α-SMA proteins through immunoblotting. (E,F) Quantitative RT-PCR (qRT-PCR) used to assess mRNA levels fibronectin and α-SMA. Data represent the mean ± SEM for six mice ineach group. *p < 0.01, **p < 0.005, ***p < 0.001.
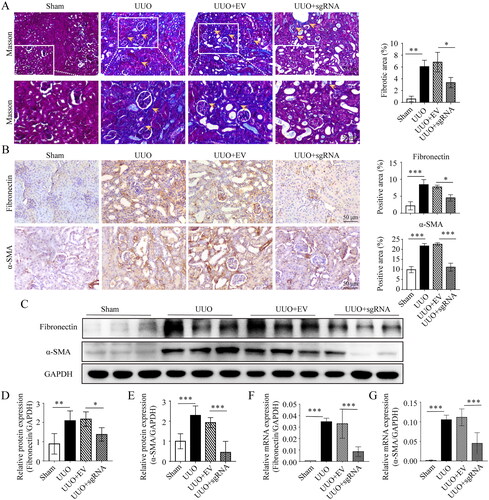
Figure 4. Influence of Circ1647 on Extracellular Matrix (ECM) Protein Synthesis in Renal Tubular Epithelial Cells. (A) Detection of overexpressed Circ1647 levels in vivo by qRT-PCR. (B,C) Detection of RNA levels of fibronectin and α-SMA in TCMK1 cell. (D,E) Fibronectin and α-SMA were detected by immunoblotting and relative quantification. Data represent the mean ± SEM for at least three independent experiments. *p < 0.01, **p < 0.005, ***p < 0.001.
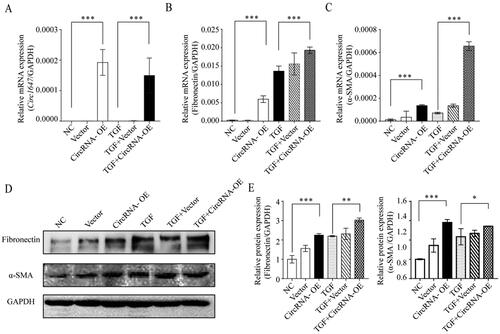
Figure 5. Circ1647 promotes the abnormal activation of PI3K/AKT signaling in UUO mice. (A–C) Immunoblotting and quantitative analysis for phosphorylated AKT (p-AKT) relative to total AKT andphosphorylated PI3K (p-PI3K) relative to total PI3K in kidney tissues. (D,E) Assessment of p-AKT/AKT and pPI3K/PI3K in TCMK1 cells transfected with Circ1647 to evaluate its impact on the PI3K/AKT signaling pathway, using immunoblotting and quantitative methods. Data from animal experiments represent the mean ± SEM of six mice per group. Data from cell experiments represent the mean ± SEM of at least three independent experiments. *p < 0.01, **p < 0.005, ***p < 0.001.
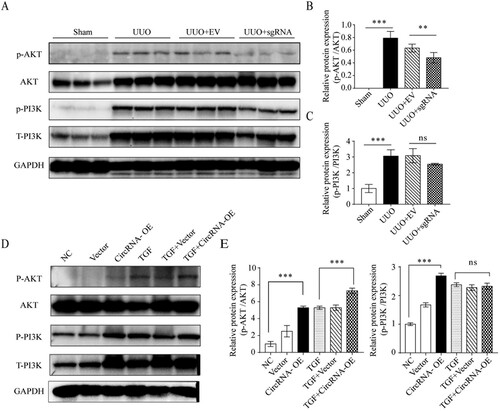
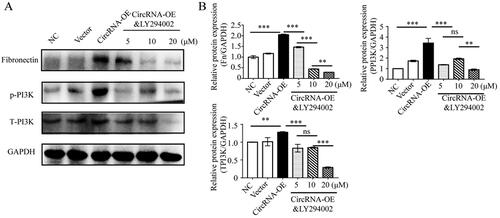
Figure 6. Circ1647 Enhances Renal Tubular Cell Fibrosis via the PI3K Pathway. (A,B) Immunoblotting andquantitative analysis of Fibronectin and the p-PI3K/PI3K ratio in TCMK1 cells. These cells were transfectedwith Circ1647 and then treated with various concentrations of the PI3K inhibitor LY294002 for 24 h, post-transfection. Data represent the mean ± SEM for at least three independent experiments. *p < 0.01, **p < 0.005, ***p < 0.001.
Data availability statement
Data supporting the findings of this study are available from the corresponding author upon reasonable request.