
Figures & data
Table 1. Formulas for estimating glomerular filtration rate.
Table 2. Baseline characteristics of patients with type 2 diabetes.
Figure 1. The association between FRS and eGFRcystatin C/eGFRcreatinine ratio at 4 ranges in univariate analysis.
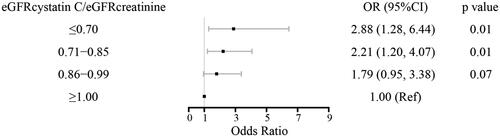
Table 3. Association between baseline characteristics of T2DM and Framingham risk score (univariate Ordinal logistic regression analysis).
Table 4. Association between continuous eGFRcystatin C/eGFRcreatinine and Framingham risk score (multivariate Ordinal logistic regression analysis).
Table 5. Association between eGFRcystatin C/eGFRcreatinine≤0.85 and Framingham risk score (multivariate Ordinal logistic regression analysis).
Availability of data and materials
Data used to support the findings of this study are available from the corresponding author upon request.