
Figures & data
Table 1. Baseline characteristics of the studied groups.
Table 2. . Different levels of U-NGAL and U-KIM-1 in groups 1 and 2.
Figure 1. Predictive margins for Urinary KIM-1 and HRS with 95% confidence intervals. The increasing levels of Urinary KIM-1 were not associated with an increasing probability of HRS in the univariate analysis.

Figure 2. Predictive margins for Urinary NGAL and HRS with 95% confidence intervals. The increasing levels of Urinary NGAL were not associated with an increasing probability of HRS in the univariate analysis.
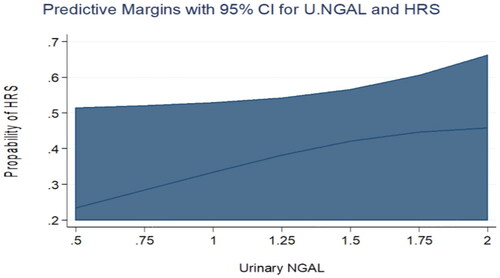
Figure 3. shows the receiver operating curve (ROC) for the sensitivity and specificity of Urinary KIM-1 for the prediction of the occurrence of HRS. At the level of 2.4 ng/mL (the 75th percentile), the area under curve was 0.88. Specificity and sensitivity were 61.1% and 52.9%, respectively at the same level.
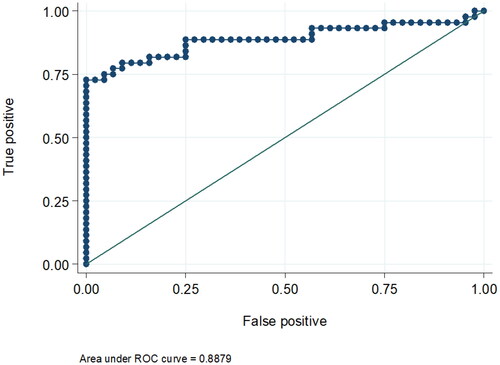
Table 3. Association between urinary KIM-1 and NGAL and the presence of HRS.
Table 4. Estimation of the cutoff value of U-KIM-1 in patients with HRS.