
Figures & data
Table 1. Demographic and clinical data of PD patients (N = 602).
Table 2. Symptom prevalence, distress, severity, and frequency in PD patients (N = 602).
Table 3. Factor loading of total symptom score in PD patients (N = 602).
Figure 1. Network relationship map of symptoms in PD patients. This figure illustrates the network of 22 symptom connections in PD patients, highlighting significant relationships: a strong link between decreased sexual interest and arousal difficulties, foam urine’s strong tie to nocturia and moderate association with itching and dry skin, facial edema’s moderate link to leg swelling, and the moderate connection between frequent waking and sleep initiation troubles. This map offers a concise overview of symptom interactions in PD.
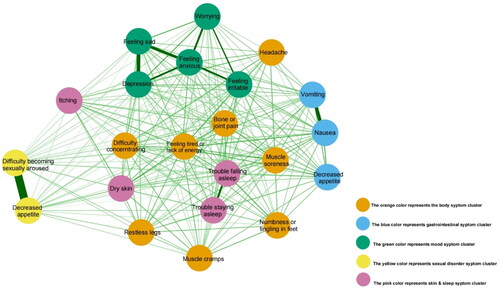
Figure 2. Centrality analysis of symptoms in PD patients. The figure illustrates centrality analysis results for PD, pinpointing decreased interest in sex and difficulty becoming sexually aroused as the most central and influential symptoms based on strength. These key symptoms are highlighted for their significant roles within the network, marked by high weights and strong influence.
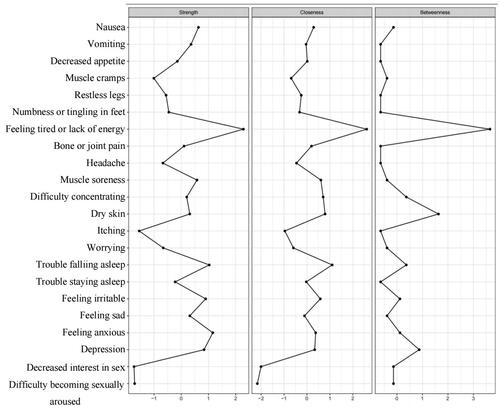
Figure 3. Bootstrap analysis results of the edge weights. This figure displays bootstrap analysis results of network in PD patients, with the red line showing sample values and the gray area indicating bootstrapped confidence intervals. The consistent narrow CIs across all edges, ordered by weight, confirm the accuracy of the network’s structure.
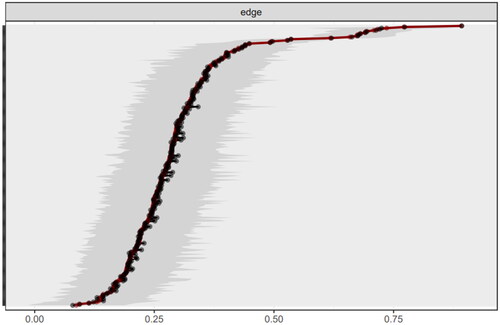
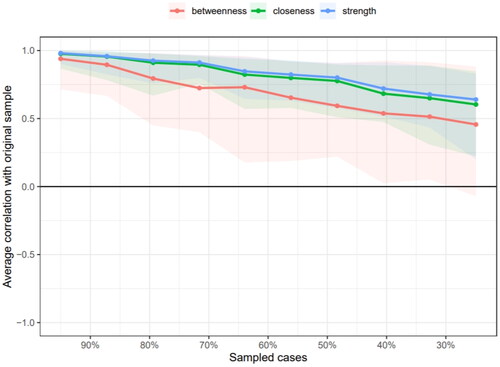
Figure 4. Correlation stability coefficient of symptom network in PD patients. The figure presents the PD symptom network’s stability, with strength correlation coefficients consistently above 0.5, affirming network reliability. It also shows strength centrality’s superior stability over closeness and betweenness measures.
Supplemental Material
Download MS Word (24.2 KB)Data availability statement
The data that support the findings of this study are available from the corresponding author upon reasonable request.