
Figures & data
Figure 1. PRISMA 2020 flow diagram.
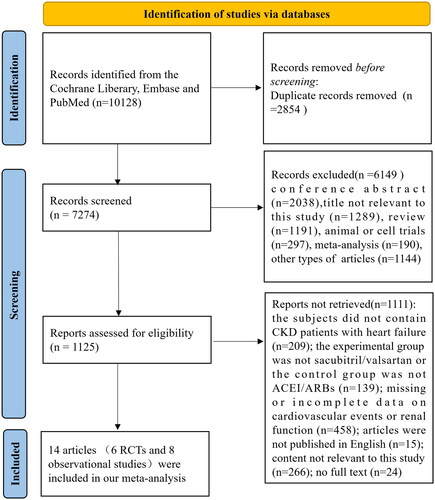
Table 1. Baseline characteristic of included studies.
Figure 2. Results of cardiovascular events. (A) Forest plot showing the difference in cardiovascular events between sacubitril/valsartan and control group. (B) Funnel plot of cardiovascular events. Note: Berg et al. defined cardiovascular events as a composite of cardiovascular death or rehospitalization for heart failure [Citation12]; Chen et al. described cardiovascular events as rehospitalization for heart failure and all-cause death [Citation24]; Damman et al. Chang et al. Hsiao et al. Lee et al. and Tsutsui et al. described cardiovascular events as cardiovascular death or heart failure hospitalization [Citation15,Citation19,Citation21–23,Citation26]; Mc Causland et al. defined cardiovascular events as a composite of total (first and recurrent) hospitalizations for heart failure and death from cardiovascular causes; In Sheng et al.’s research, cardiovascular events were regarded as the rehospitalization of patients due to acute myocardial ischemia, HF, thromboembolic or hemorrhagic stroke, arrhythmia, and peripheral vascular disease [Citation20]; Niu et al. regarded cardiovascular events as hospitalization because of cardiovascular diseases [Citation14].
![Figure 2. Results of cardiovascular events. (A) Forest plot showing the difference in cardiovascular events between sacubitril/valsartan and control group. (B) Funnel plot of cardiovascular events. Note: Berg et al. defined cardiovascular events as a composite of cardiovascular death or rehospitalization for heart failure [Citation12]; Chen et al. described cardiovascular events as rehospitalization for heart failure and all-cause death [Citation24]; Damman et al. Chang et al. Hsiao et al. Lee et al. and Tsutsui et al. described cardiovascular events as cardiovascular death or heart failure hospitalization [Citation15,Citation19,Citation21–23,Citation26]; Mc Causland et al. defined cardiovascular events as a composite of total (first and recurrent) hospitalizations for heart failure and death from cardiovascular causes; In Sheng et al.’s research, cardiovascular events were regarded as the rehospitalization of patients due to acute myocardial ischemia, HF, thromboembolic or hemorrhagic stroke, arrhythmia, and peripheral vascular disease [Citation20]; Niu et al. regarded cardiovascular events as hospitalization because of cardiovascular diseases [Citation14].](/cms/asset/a6985d0c-fa5f-4b36-afeb-5fd8e8000f9b/irnf_a_2349135_f0002_c.jpg)
Figure 3. Results about cardiovascular events. (A) Forest plot about changes in Scr. (B) Forest plot regarding changes in eGFR. (C) Meta-analysis of the incidence of ESRD in CKD stages 3–5 patients with heart failure. *Berg et al. defined the change of Scr as an increase in serum creatinine of at least 0.5 mg/dL; **Mc Causland et al. were described the change of Scr as elevated serum creatinine ≥ 2.0 mg/dL; *** Tan et al. described the change of Scr as doubling of serum creatinine; ****Voors et al. defined the change of Scr as >0.3 mg/dL increase in creatinine in combination with an increase of more than 25% in serum creatinine between two time points. †In the Chen’s study, the PARADIGM-HF trial and the PARAGON-HF trial, eGFR level declined >50% from baseline; ††In the Berg et al.’s trial, eGFR level declined >25% from baseline; †††In the Tan’s study, eGFR level declined >30% or more from baseline.
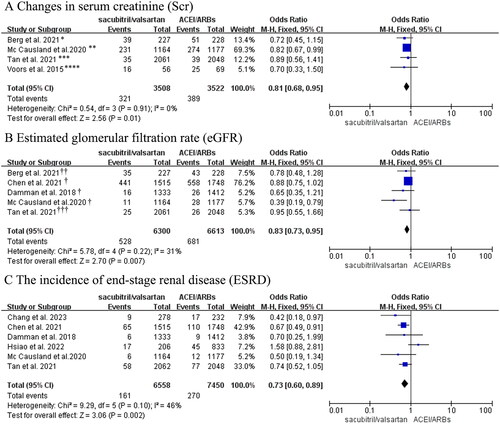
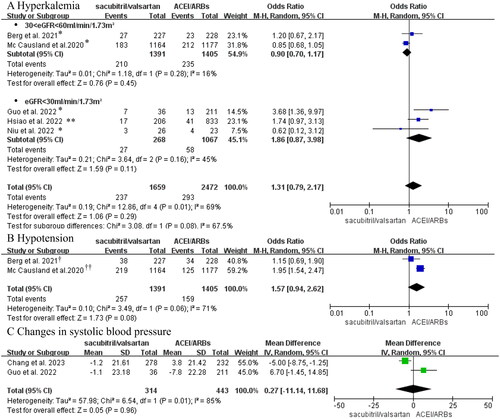
Figure 4. (A) Forest plot of the incidence of hyperkalemia. (B) Meta-analysis of the incidence of hypotension in CKD stages 3-5 patients with heart failure. (C) Forest plots of changes in blood pressure. *Hyperkalemia was defined as potassium > 5.5 mmol/L in these studies; ** Hyperkalemia was defined as potassium > 6mmol/L in Hsiao’s study. †Berg et al. regarded hypotension as symptomatic hypotension; ††Hypotension in the Mc Causland et al.’s trial was regarded as SBP < 100 mmHg.
Supplemental Material
Download PDF (443.8 KB)Data availability statement
All data generated or analyzed during this study are included in this article or Supplementary files.