
Figures & data
Figure 1. Patient flowchart for Phase 1.
A total of 2,369 patients were identified from the database, and the application of the exclusion criteria resulted in a study population of 1,899 patients. Participants were classified into three groups based on the T-Bil levels on day 0 and day 3 after CRRT.
CRRT, continuous renal replacement therapy; T-Bil, total bilirubin
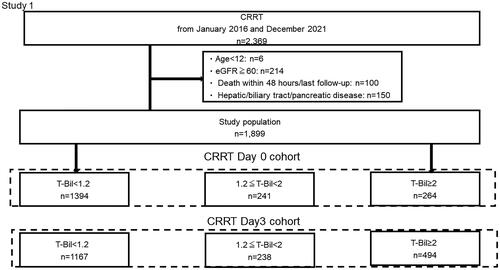
Table 1. Patient characteristics stratified according to T-Bil on the day of CRRT initiation.
Table 2. Patient characteristics stratified according to the T-Bil level on day 3 post-CRRT initiation.
Figure 2. Kaplan–Meier curve for 90-day total mortality of the participants classified into three groups based on the T-Bil levels on day 0 and day 3 after CRRT.
On both day 0 and day 3 after CRRT initiation, the mortality rate was significantly higher in groups 2 and 3 than that in group 1.
CRRT, continuous renal replacement therapy; T-Bil, total bilirubin
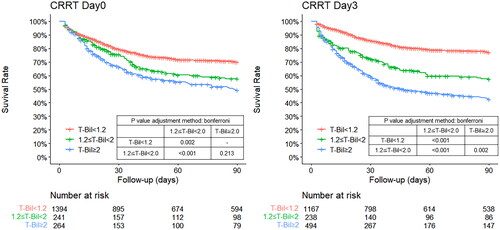
Table 3. Cox regression analysis: Factors associated with 90-day mortality.
Figure 3. Patient flowchart for Phase 2.
After applying the exclusion criteria, the remaining 1,899 patients were classified based on the T-Bil cutoff of 1.2 mg/dL on day 3 after CRRT. After matching, 354 pairs were examined.
CRRT, continuous renal replacement therapy; T-Bil, total bilirubin
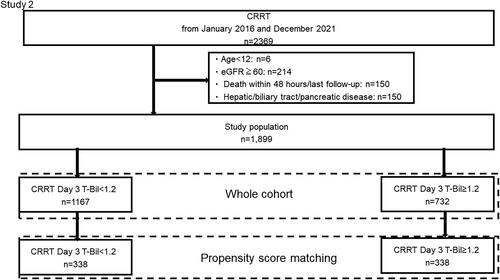
Figure 4. Kaplan–Meier curve for 90-day total mortality of the participants classified into two groups based on the T-Bil cutoff of 1.2 on day 3 after CRRT.
The cohort matched with the whole cohort. The T-Bil ≥ 1.2 group had a significantly higher mortality rate, even after propensity-score matching.
CRRT, continuous renal replacement therapy; T-Bil, total bilirubin
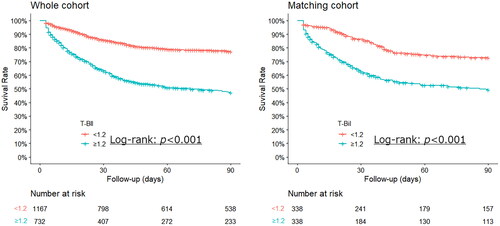
Table 4. Cox regression analysis: Factors associated with 90-day mortality in cases after propensity score matching.
Supplemental Material
Download MS Word (29.2 KB)Data availability statement
The datasets generated and analyzed during the current study are available from the corresponding author on reasonable request.