Figures & data
Figure 1. Flow diagram for recruitment of participants in the study.
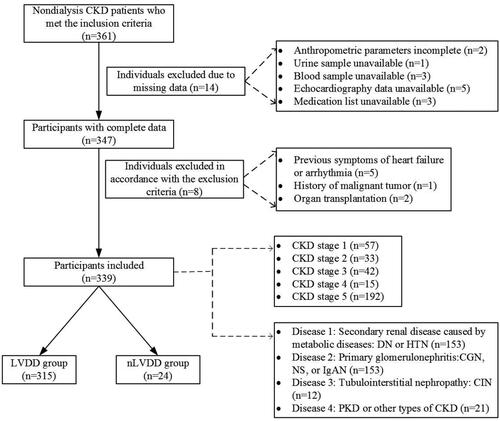
Figure 2. Algorithm for diagnosis of LVDD in subjects with normal LVEF [Citation24].
![Figure 2. Algorithm for diagnosis of LVDD in subjects with normal LVEF [Citation24].](/cms/asset/f93ab148-4c6a-4869-84af-983c25b79b6e/irnf_a_2353334_f0002_b.jpg)
Figure 3. The proportion of ALVDD in nondialysis CKD stages 1–5.
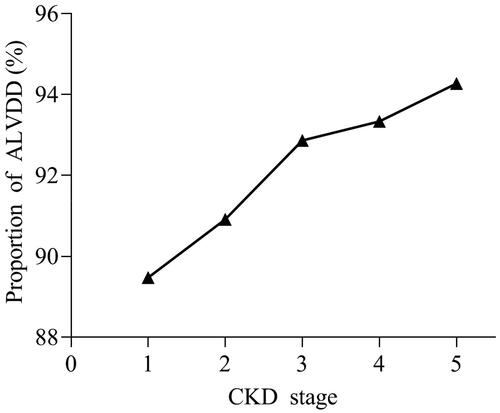
Figure 4. The proportion of ALVDD in nondialysis CKD classified by causes.
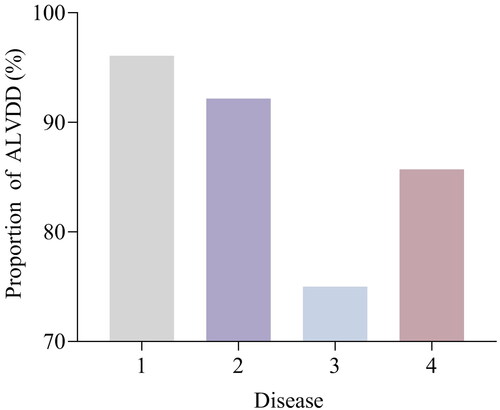
Table 1. Comparison of baseline data between LVDD and nLVDD in CKD patients.
Figure 5. Multivariate logistic regression analysis of ALVDD in nondialysis CKD patients.
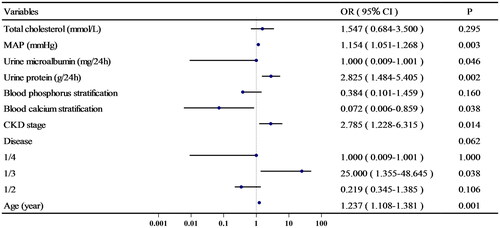
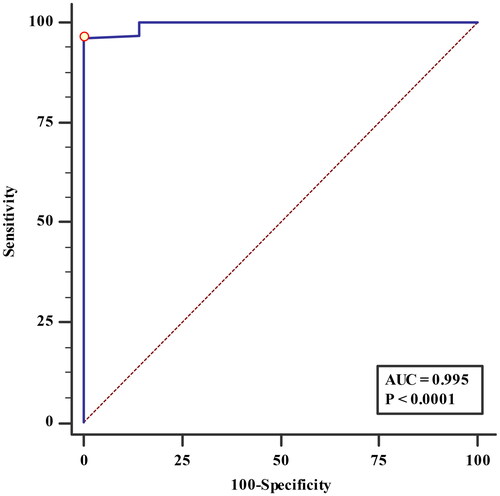
Figure 6. The ROC curve of the probability value predicted by the multivariate logistic regression model.