
Figures & data
Figure 1. CONSORT diagram of participants flowchart.
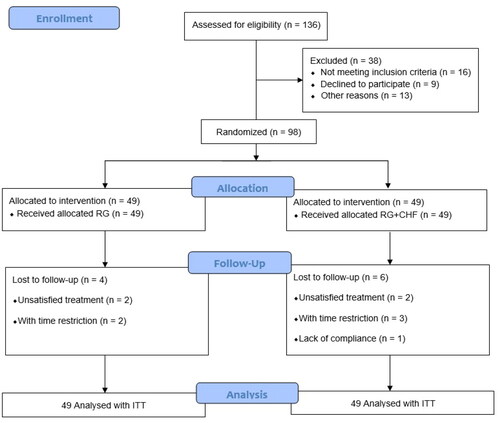
Figure 2. (A) PCA scores of serum samples in the two groups (t[Citation1] represents the first principal component and t[Citation2] represents the second principal component); (B) Scores of OPLS-DA model in serum samples of two groups; (C) VIP scores of serum samples in the two groups (Red and yellow are the parts of VIP ≥ 1. In order to show that bar does not contain 0 area, the chart with yellow bar is displayed.); (D) Results of 999 permutation and combination experiments.
![Figure 2. (A) PCA scores of serum samples in the two groups (t[Citation1] represents the first principal component and t[Citation2] represents the second principal component); (B) Scores of OPLS-DA model in serum samples of two groups; (C) VIP scores of serum samples in the two groups (Red and yellow are the parts of VIP ≥ 1. In order to show that bar does not contain 0 area, the chart with yellow bar is displayed.); (D) Results of 999 permutation and combination experiments.](/cms/asset/615481d2-a632-405c-957a-4beab5aae40a/irnf_a_2356021_f0002_c.jpg)
Figure 3. (A) Differential lipid Venn diagram of different models; (B) Lipid clustering heat maps of different serum samples between the two groups; (C) Heat map of different lipid correlation matrix in serum samples of the two groups.
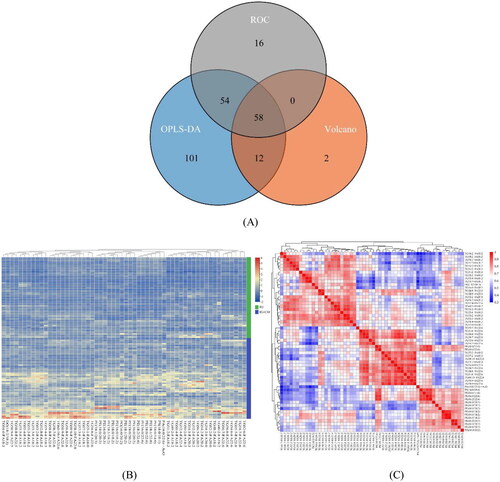
Table 1. Participants baseline data.
Figure 4. Analysis of underlying CKD diseases (left) and A on C causes (right).
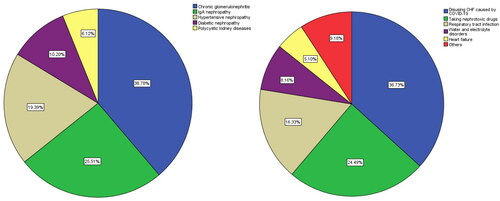
Figure 5. Comparison of renal function indexes between two groups.
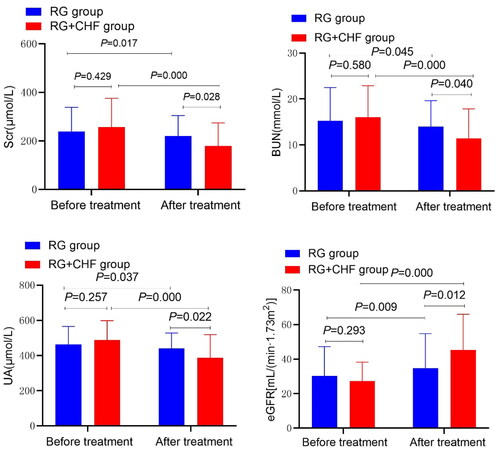
Table 2. Comparison of clinical outcome between two groups.
Table 3. Comparison of effective rate between two groups.
Table 4. VIP, P and FDR values of 58 different metabolites.
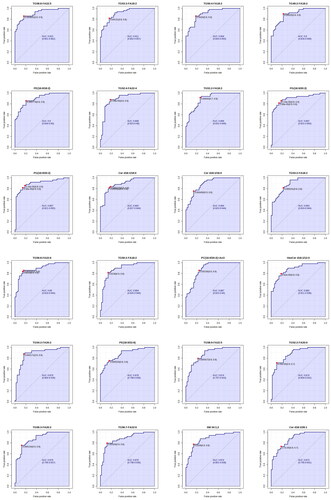
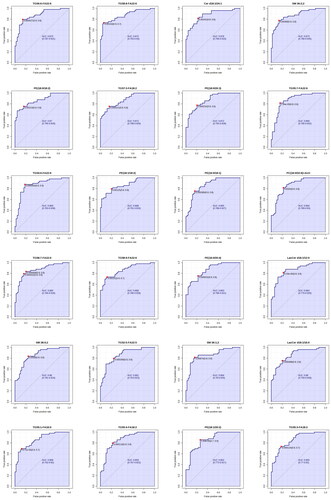
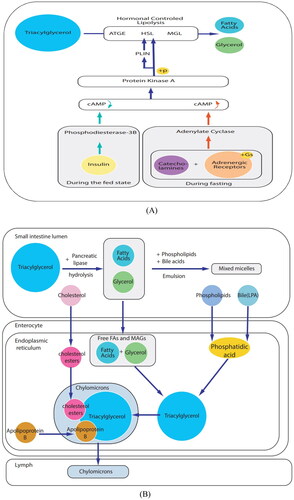
Figure 7. Potential lipid biomarkers pathway. (A) Triglyceride metabolic pathway; (B) Metabolic pathways of fat digestion and absorption.
Data availability statement
Data from this study will not be disclosed to the public because the experimental data contain sensitive data and patients’ privacy. All authors confirm the authenticity and availability of data upon request. If original data and materials are needed, request should be sent to the corresponding author, Xuezhong Gong ([email protected]).