
Figures & data
Figure 1. Flowchart of patient enrollment and follow-up.
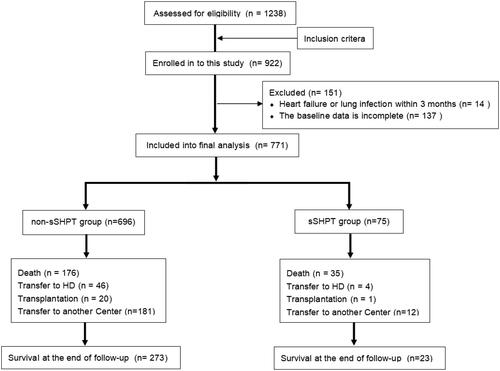
Table 1. Baseline clinical characteristics and serum parameters of patients with sSHPT on PD.
Table 2. Risk factors for progression to sSHPT in patients on PD in multivariable logistic regression analysis.
Figure 2. Kaplan–Meier’s survival curves of the sSHPT group and non-rSHPT group for OW cumulative mortality.
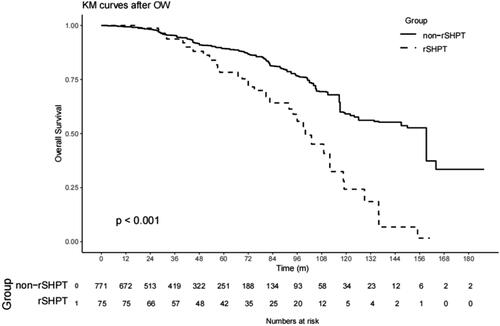
Figure 3. Kaplan–Meier’s survival curves of the sSHPT group and non-rSHPT group for PSM cumulative mortality.
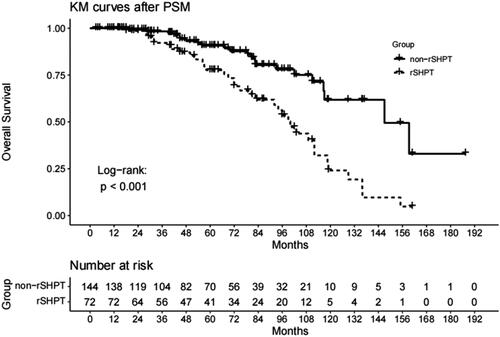
Table 3. Association between the sSHPT and all-cause mortality in patients on PD in multivariable Cox regression analysis.
Figure 4. Kaplan–Meier’s survival curves of the sSHPT group and non-rSHPT group for OW infection mortality.
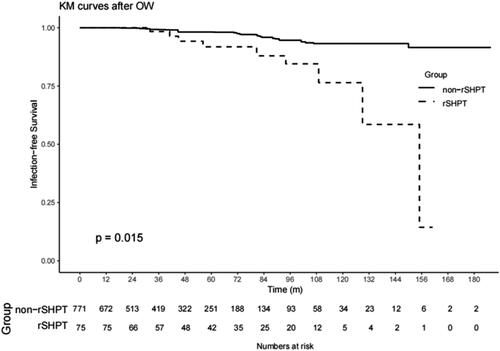
Figure 5. Kaplan–Meier’s survival curves of the sSHPT group and non-sSHPT group for PSM infection mortality.
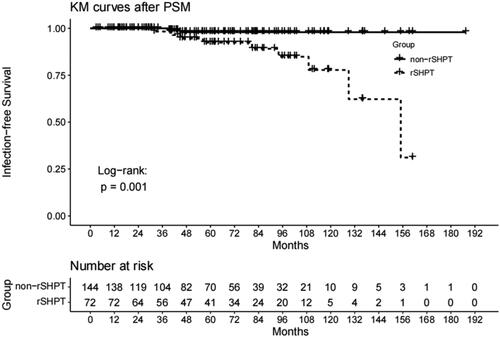
Table 4. Association between the sSHPT and mortality due to infection in patients on PD in multivariable Cox regression analysis.
Figure 6. Kaplan–Meier’s survival curves of the sSHPT group and non-sSHPT group for OW peritonitis incidence.
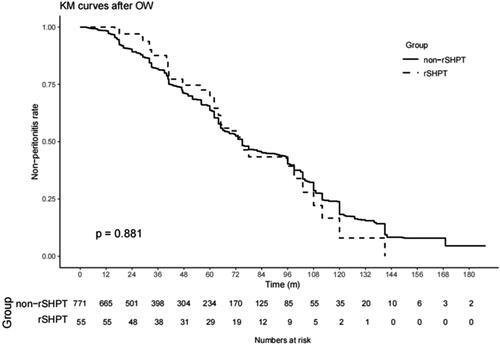
Figure 7. Kaplan–Meier’s survival curves of the sSHPT group and non-sSHPT group for PSM peritonitis incidence.
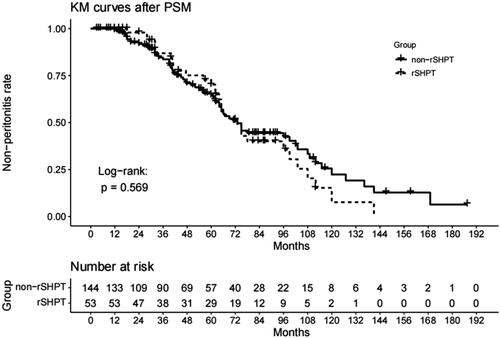
Table 5. Association between the rSHPT and peritonitis incidence in patients on PD in multivariable Cox regression analysis.
Supplemental Material
Download MS Word (22.7 KB)Data availability statement
The datasets used and/or analyzed during the current study are available from the corresponding author on reasonable request.