
Figures & data
Figure 1. Renal inflammation in mice with Con A-induced hepatitis. C57BL/6 mice were challenged (via tail vein injection) with Con A at 15 mg/kg body weight. Ten hours after injection, the serum was collected to measure alanine aminotransferase (ALT) and creatinine levels. The livers and kidneys were excised for hematoxylin/eosin (HE) staining analysis. (A) Graph showing liver injury after Con A challenge (HE staining, original magnification, ×100). (B) Statistical analysis of necrotic areas in the liver. (C) Graph showing the level of ALT. (D) Kidney histology after Con A administration. (E) Kidney injury scores were evaluated based on HE staining. (F) The creatinine levels in the urine were measured after Con A injection. (G) The creatinine levels in the serum were measured after Con A injection. The data from one representative of three experiments are shown. Each group contained 3–5 mice, * p < 0.05, **p < 0.01.
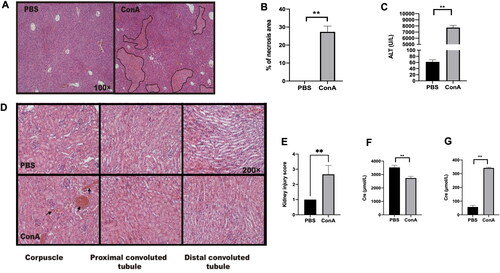
Figure 2. GL enhances the expression of IL-25 to protect against renal inflammation caused by Con A challenge. C57BL/6 mice were injected with Con A via the tail vein at a dose of 15 mg/kg body weight. GL was intraperitoneally injected 1 h before Con A injection. Kidney samples were harvested for immunohistochemistry (IHC) and PAS staining analysis 10 h after Con A injection. (A) PAS staining showing renal injury in different segments. (B) Kidney injury scores were evaluated based on PAS staining. (C) Serum creatinine levels were measured. (D) Creatinine levels in urine were measured. (E) Real-time PCR analysis of IL-6 in the kidney. (F) Real-time PCR analysis of IL-17A in the kidney. (G) IHC showing the expression of IL-25 in kidney samples from each group. (H) Image-Pro Plus 6.0 was used to analyze the integrated optical density (IOD) of IL-25 in kidney. (I) Evaluation of IL-25 in kidney tissue homogenates by ELISA. The values are the means ± SDs; *p < 0.05, **p < 0.01. All the data shown here are representative of independent experiments with similar results. The results of at least three independent experiments with 3–5 mice per group are shown.
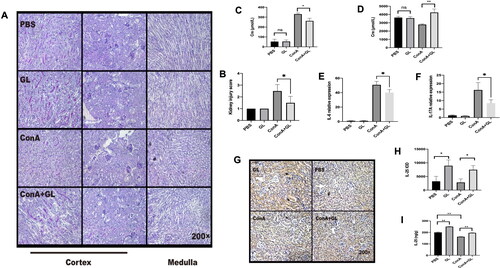
Figure 3. Administration of IL-25 protects against Con A-induced inflammation and functional impairment of the kidney in mice. C57BL/6 mice were injected with Con A via the tail vein at a dose of 15 mg/kg body weight. IL-25 was intraperitoneally injected 1 h before Con A injection. Kidney samples were harvested for PAS staining analysis 10 h after Con A injection. (A) Mice were administered Con A and/or IL-25, and kidney sections were stained with PAS. (B) Kidney injury scores were evaluated based on PAS staining. (C) The levels of creatinine in the serum were determined. (D) The levels of creatinine in urine were determined. The graphs show that IL-25 could ameliorate renal injury and functional impairment induced by Con A challenge. The values are the means ± SDs; *p < 0.05, **p < 0.01. The experiments were independently carried out at least 3 times, n = 3–5.
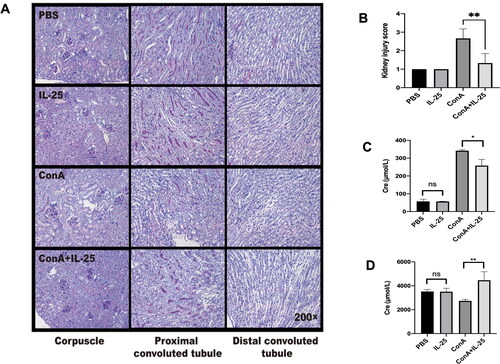
Figure 4. IL-25 inhibits Con A-induced expression of TLR4 and IL-1β and upregulates the production of IL-10 by macrophages. (A) TLR4 expression in peritoneal macrophages cultured with IL-25 and/or Con A for 10 h was detected by FACS. (B) The TLR4 receptor on macrophages was upregulated by Con A and downregulated by IL-25. (C) The levels of the cytokines IL-1β and IL-10 (D) in the culture medium were assessed, and IL-10 was significantly increased after IL-25 treatment. The values are the means ± SDs; *p < 0.05, **p < 0.01. The experiments were independently carried out at least 3 times, n = 3–5.
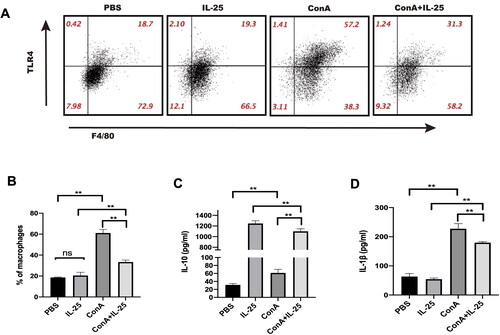
Figure 5. GL and IL-25 enhances the expression of CD206 in the kidney and in macrophages. (A) Real-time PCR analysis of CD206 in the kidney. CD206 expression was upregulated in the GL treatment groups. (B) IF staining of kidney sections from the different treatment groups following CD206 staining (red). CD206 expression was upregulated in the IL-25 treatment groups. (C) Peritoneal macrophages were cultured with IL-25 and/or Con A, and the CD206 receptor was detected by IF (red). The values are the means ± SDs; *p < 0.05, **p < 0.01. A representative experiment of at least three independent experiments with 3 mice per group is shown.
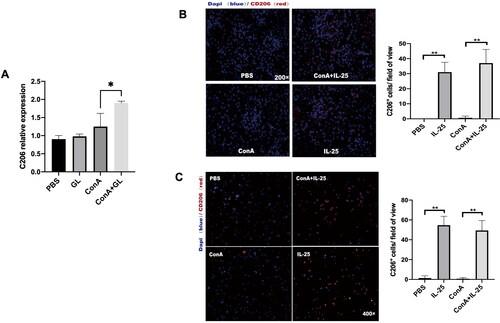
Figure 6. TLR4 is required for the IL-25-induced increase in CD206 expression by macrophages. (A) TLR4-deficient mice in the PBS group had more M2 macrophages than wild-type () and TLR2-deficient mice (). (B) Peritoneal macrophages from TLR2–/– mice were cultured in vitro and challenged with IL-25 or Con A. (C) Peritoneal macrophages from TLR4–/– mice were cultured in vitro and challenged with IL-25 or Con A. After 10 h, the CD206 receptor (red) was detected by IF. The values are the means ± SDs; *p < 0.05, **p < 0.01. A representative experiment of at least three independent experiments with 3 mice per group is shown.
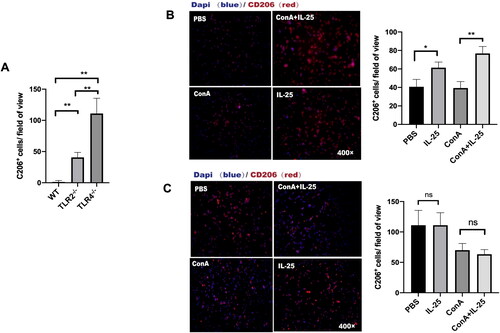
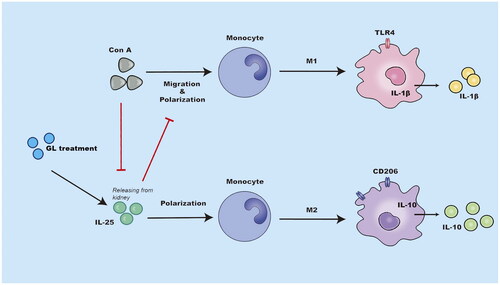
Figure 7. Schematic representation of the immunoregulatory role of IL-25 in Con A-induced inflammation of the kidney. The administration of glycyrrhizin enhances the production of IL-25, which is an anti-inflammatory cytokine, in the context of Con A challenge. IL-25 promotes the polarization of type 2 macrophages while inhibiting the generation of type 1 macrophages to restrain inflammation in the kidney elicited by Con A challenge..
Data availability statement
The datasets used and/or analyzed during the current study are available from the corresponding author upon reasonable request.