
Figures & data
Figure 1. Workflow diagram for Mendelian randomization analysis.
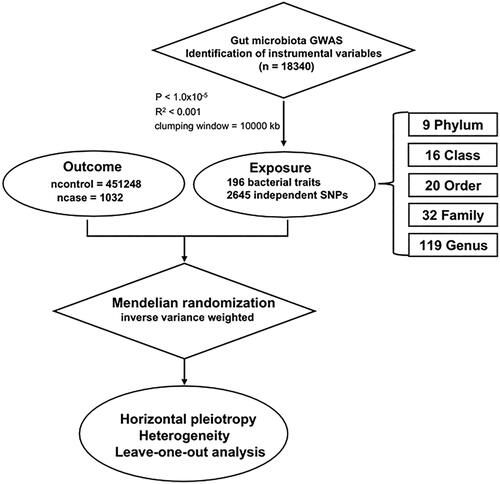
Figure 2. Forest plot of IVW analysis results of the effect of GM on DN. CI: confidence interval; OR, odds ratio; SNP: single nucleotide polymorphism.
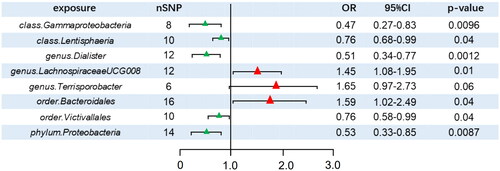
Figure 3. Leave-one-out plots for the causal association between GM and DN.
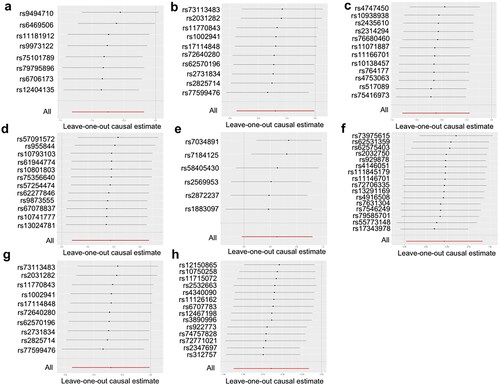
Table 1. The heterogeneity of gut microbiota instrumental variables.
Table 2. Directional horizontal pleiotropy assessed by intercept term in MR Egger regression of the association between gut microbiota and DN.
Supplemental material
Supplemental Material
Download MS Excel (23 KB)Data availability statement
The source of the GM data is the MiBioGen consortium (https://mibiogen.gcc.rug.nl/) and the source of the diabetic nephropathy data is the IEU public database (https://gwas.mrcieu.ac.uk/).