
Figures & data
Figure 1. Representative pathological images (original magnification, ×200) and correlation analysis in DPLN patients. A, Representative images of noAKI patients showed endocapillary proliferation; B, Representative images of AKI patients showed endocapillary proliferation with interstitial leukocytes. C, Correlation analysis between AKI and clinical pathological characteristics revealed AKI was related to interstitial leukocytes in DPLN patients. AKI, acute kidney injury; SBP: systolic blood pressure; DBP: diastolic blood pressure; Hb: hemoglobin; ALB: serum albumin; C3, Serum complement3; dsDNA, anti-double stranded DNA; UACR, urine albumin to creatinine ratio; eGFR, evaluated glomerular filtration rate; Endo, endocapillary hypercellularity; Neutro, neutrophils; Intersti, interstitial leukocytes; Corr, correlation (R).
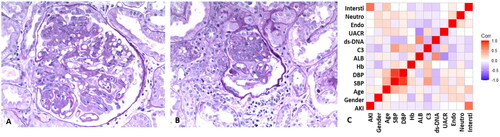
Table 1. Clinical characteristics of endocapillary DPLN patients.
Figure 2. The representative pathological changes of MRL/lpr mice and C57 mice. A, AKI mice with endocapillary proliferation and interstitial inflammation in vehicle group (PAS staining, ×200); B, noAKI mice with endocapillary proliferation in vehicle group(PAS staining, ×200); C, C57 mice with normal renal pathological changes(PAS staining, ×200); D, AKI mice with endocapillary proliferation and interstitial inflammation in vehicle group (H&E staining, ×100); E, noAKI mice with endocapillary proliferation in vehicle group (H&E staining, ×100); F, C57 mice with normal renal pathological changes (H&E staining, ×100).
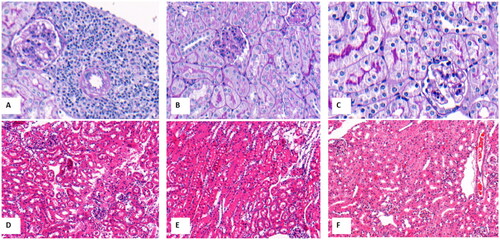
Figure 3. Expression of STAT3, pSTAT3 and Caspase-1. (A) Western blot analyses of STAT3, pSTAT3, Caspase -1 in renal cortex tissues. (B) Relative STAT3 protein expression. (C) Relative pSTAT3 protein expression. (D) Relative caspase-1 protein expression. (E) STAT3 mRNA expression. (F) Caspase-1 mRNA expression.
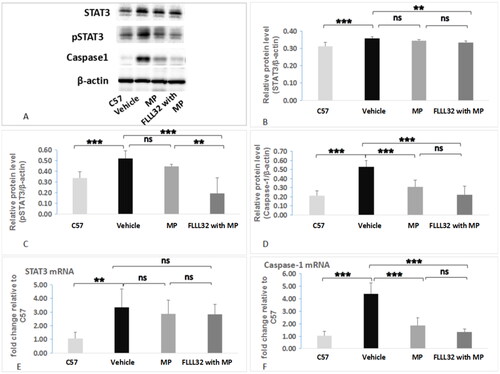
Figure 4. Representative images of pSTAT3 expression in renal tissue (immunochemistry staining, ×200) A. pSTAT3 expression in C57 mice; B, pSTAT3 expression in MRL/lpr mice treated with vehicle group; C, pSTAT3 expression of MRL/lpr mice treated with MP; D, pSTAT3 expression of MRL/lpr mice treated with FLLL32 with MP; E, Quantification analysis of pSTAT3-positive areas among four groups.
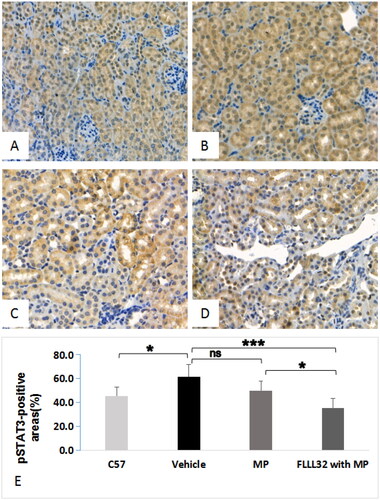
Figure 5. Representative images (H&E staining, original magnification, ×50) and renal interstitial leukocytes. A, AKI mice in vehicle group showed remarkable interstitial infiltration of inflammatory cells; B, noAKI mice in MP group with less interstitial infiltration of inflammatory cells; C, noAKI mice in FLLL32 with MP group with less interstitial infiltration of inflammatory cells. D, comparison of interstitial inflammation.
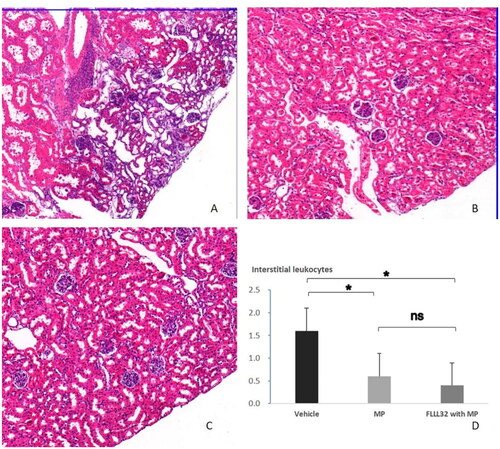
Table 2. Comparison of characteristics among four groups.
Data availability statement
The raw data supporting the conclusions of this article will be made available by the corresponding author, without undue reservation.