
Figures & data
Table 1. Characteristics of patients with different outcomes.
Figure 1. Flowchart of study participants. PMN, Primary membranous nephropathy; sMN, secondary membranous nephropathy; anti-PLA2R Ab, anti-phospholipase A2 receptor antibody; CR, complete remission; PR, partial remission; NR, non-remission.
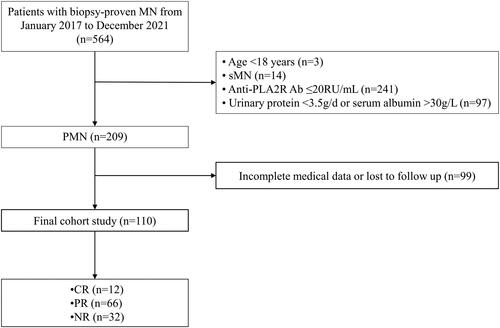
Figure 2. Association of FAR and treatment response in all enrolled patients. A. Predictive performances of FAR for remission outcomes (CR or PR) evaluated by ROC curves. B. Incidence of CR and PR between groups stratified for FAR levels by Kaplan-Meier survival curve. Anti-PLA2R Ab positive PMN patients with FAR ≤ the cutoff value at the time of renal biopsy had significantly higher probability to achieve CR or PR compared with the patients with FAR above the cutoff (Log Rank test, p = 0.021). AUC, the area under the ROC curve; ROC, receiver operating characteristic.
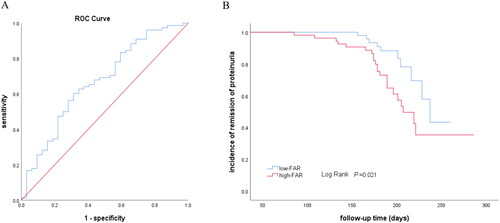
Table 2. Clinical and pathological features of patients with PMN according to different levels of FAR.
Table 3. Correlations between FAR and clinical and pathologic parameters.
Table 4. Risk factors of non-remission in PMN determined by univariate and multivariate cox regression.
Figure 3. Association of FAR and treatment response in CNIs-receivers (A) Incidence of CR and PR between groups stratified for FAR levels by Kaplan-Meier survival curve in CNIs-receivers. (B) Predictive performances of variables for remission evaluated by ROC curves. ROC curve of FAR, anti-PLA2R Ab, and combination of FAR and anti-PLA2R Ab for remission outcomes. The AUC and the cutoff value of variables were presented in a separate table under the figure. *: Pairwise comparison; aFAR vs FAR + anti-PLA2R Ab; banti-PLA2R Ab vs FAR + anti-PLA2R Ab; cFAR vs anti-PLA2R Ab. FAR, fibrinogen-albumin ratio; CNIs, calcineurin Inhibitors; CR, complete remission; PR, partial remission; ROC, receiver operating characteristic. AUC, the area under the ROC curve.
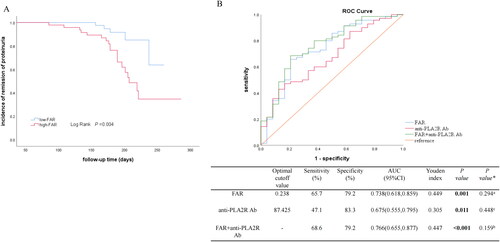
Table 5. Risk factors of non-remission in CNIs-receivers determined by univariate and multivariate cox regression.