
Figures & data
Figure 1. We selected the optimal slice from the original image to visualize the renal cortex and medulla for each quantitative parameter. IVIM diffusion weighted image obtained with b = 0 s/mm2 (the top row) and IVIM-derived parameters (ADC; D; D*; f) of contralateral kidney (the 2nd to 5th row). These IVIM parameter maps of the right kidney depicted rat study case prior to left kidney ligation and at 3, 7, 10, 14, 21, 28, 35, 42 days postligation. Over time, in the unobstructed side, the color gradient deepened between the cortex and medulla in ADC, D, and f parameter images, whereas the color change was less pronounced in the D* parameter image.
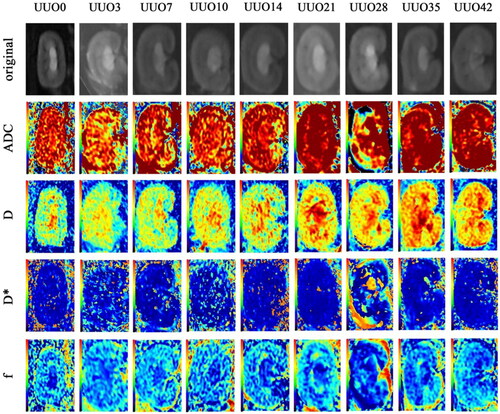
Figure 2. Histological analysis (H&E & Masson staining, × 200) of contralateral kidneys from the UUO models revealed varying degrees of pathological changes. These included swelling of the renal tubular epithelial cells, increasing numbers of inflammatory cells, dilation and deformation of renal tubules, and progressive glomerulosclerosis over time. Masson staining results demonstrated a corresponding increase in fibrosis severity in the contralateral kidney with the duration of left ureteral obstruction, particularly evident in the medulla.
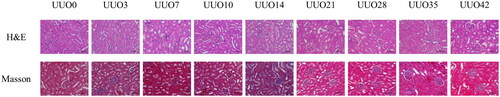
Figure 3. The boxplots depicted the IVIM-derived parameters of contralateral kidney. (a) Cortical ADC values were statistically different between the UUO7 group and the sham group (p < 0.01). (b) Cortical D values exhibited a statistically significant difference between the UUO3 group and the sham group (p < 0.01). (c) Comparison of cortical D* values revealed no significant difference at any time point. (d) Cortical f values showed statistical significance between the UUO21 group and the sham group (p < 0.001). (e) Medullary ADC values in the UUO10 group differed significantly from those in previous groups (p < 0.01). (f) the difference of medullary D values between the UUO14 group and the sham group was statistically significant (p < 0.01). (g) Comparison of medullary D* values revealed no significant difference at any time point. (h) Medullary f values exhibited statistical significance between the UUO21 group and the sham group (p < 0.01).
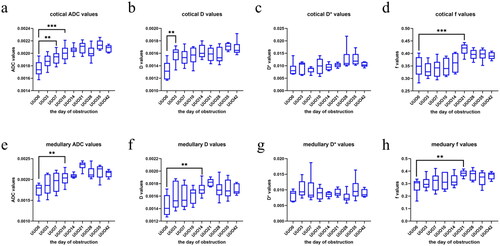
Table 1. Summary of mean values and standard deviations for the contralateral kidney cortex parameters (ADC, D*, D, and f) in a unilateral ureteral obstruction in rats.
Table 2. Summary of mean values and standard deviations for the contralateral kidney medulla parameters (ADC, D*, D, and f) in a unilateral ureteral obstruction in rats.
Data availability statement
Available from the authors upon reasonable request.