
Figures & data
Table 1. Baseline characteristics of patients.
Table 2. Binary logistic regression analysis of the correlation between relevant indicators and osteoporosis in pre-dialysis patients of different genders.
Figure 1. The ROC curves and nomogram of predictive models for osteoporosis in patients of different genders. (A, B) The ROC curves and nomogram for male pre-dialysis patients. (C, D) The ROC curves and nomogram for female pre-dialysis patients. In the line corresponding to BMI, the number 1 represents normal weight (18.5 kg/m2≤BMI < 24.0 kg/m2), the number 2 represents underweight (BMI < 18.5 kg/m2), the number 3 represents overweight or obese (BMI ≥24 kg/m2). In the line segment corresponding to the stage of renal function, the number 1 represents the early stage of CKD (G1-G4), the number 2 represents the late stage of CKD (G5).
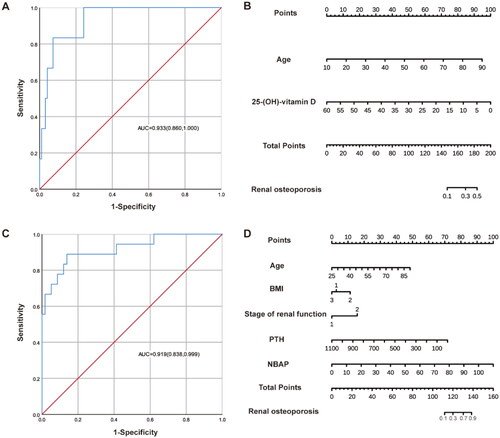
Figure 2. The ROC curves and nomograms of predictive models for osteoporosis in patients with different renal function stages. (A, B) The ROC curves and nomograms for G1-G4 patients. In the line corresponding to BMI, the number 1 represents normal weight (18.5 kg/m2≤BMI < 24.0 kg/m2), the number 2 represents underweight (BMI < 18.5 kg/m2), the number 3 represents overweight or obese (BMI ≥24 kg/m2). (C, D) The ROC curves and nomograms for G5 patients.
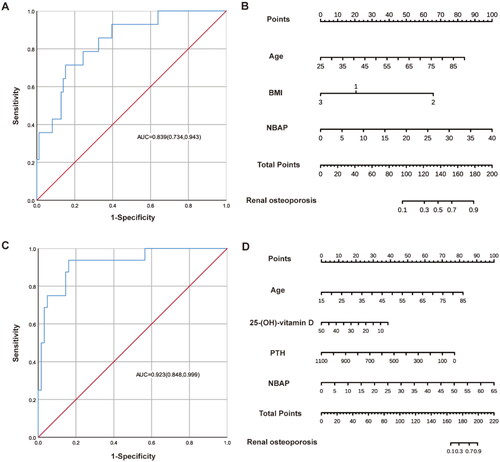
Table 3. Binary logistic regression analysis on the correlation between related indicators and osteoporosis in pre-dialysis patients with different renal function stages.